


Broadway Profiler
When running a Broadway flow, the Profiler can be enabled so that a results breakdown per Flow / Stage / Actor / Iteration can be seen. The Profiler is enabled either via the Fabric Studio, or by using the broadway command.
The Profiler provides the metrics per a single flow execution. However, when you need to monitor the behavior across many executions, you can use JMX Statistics, which also provides performance metrics per Flow / Stage / Actor / Iteration.
Trace can also be enabled on Broadway flows and can help to analyze the flow results.
How Do I Enable the Profiler in the Studio?
- To enable the Profiler, click Actions > Profiler in the Main menu toolbar and run the flow.
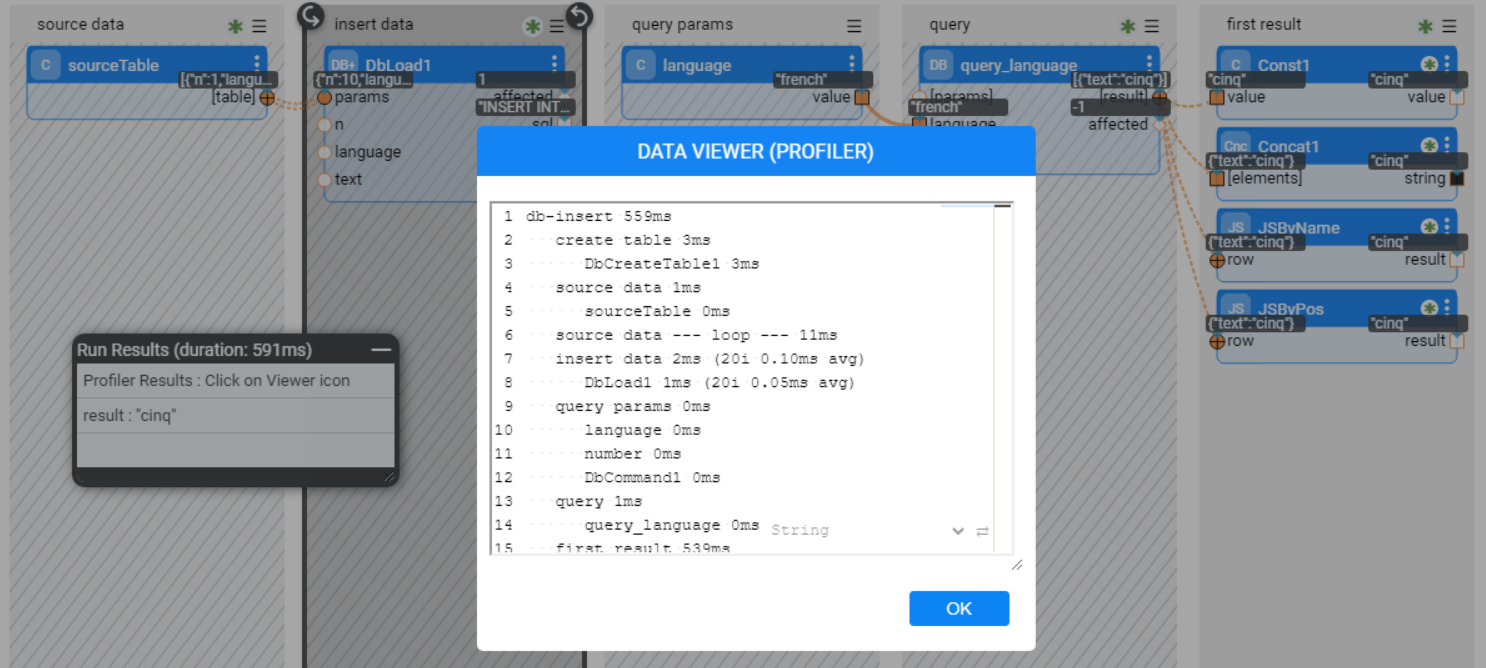
- Once the flow is completed, "Profiler Results: Click on the Viewer icon" line is displayed in the Run Results window below the flow results.
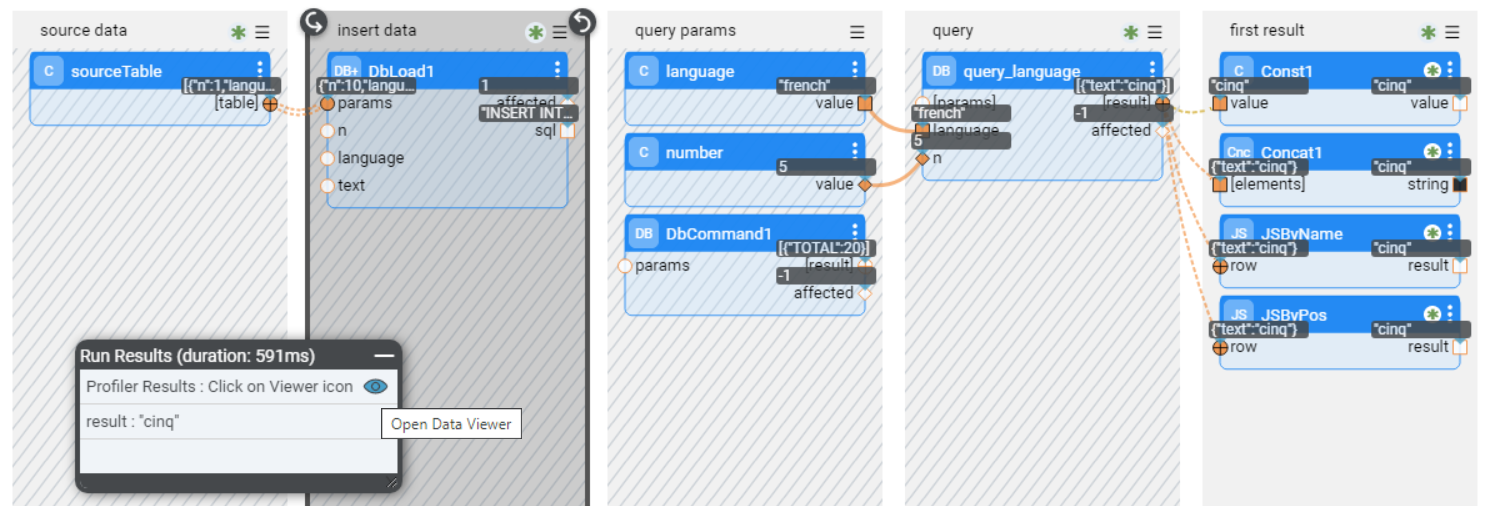
- Click on the
 icon to view the Profiler results:
How Do I Run the Profiler Via the Broadway Command?
To invoke the Profiler when running the flow using the broadway command, set the profilerTelemetry parameter to true. This will add the Profiler results to the command results.
fabric>broadway CRM.callGraphIt profilerTelemetry=true;
|column           |value                                                       |
+-----------------+------------------------------------------------------------+
|profilerTelemetry|callGraphIt 37ms
   Stage 1 6ms
      Http1 4ms
   Stage 2 18ms
      Http2 18ms|
(1 rows)


Broadway Profiler
When running a Broadway flow, the Profiler can be enabled so that a results breakdown per Flow / Stage / Actor / Iteration can be seen. The Profiler is enabled either via the Fabric Studio, or by using the broadway command.
The Profiler provides the metrics per a single flow execution. However, when you need to monitor the behavior across many executions, you can use JMX Statistics, which also provides performance metrics per Flow / Stage / Actor / Iteration.
Trace can also be enabled on Broadway flows and can help to analyze the flow results.
How Do I Enable the Profiler in the Studio?
- To enable the Profiler, click Actions > Profiler in the Main menu toolbar and run the flow.
- Once the flow is completed, "Profiler Results: Click on the Viewer icon" line is displayed in the Run Results window below the flow results.
- Click on the icon to view the Profiler results:
How Do I Run the Profiler Via the Broadway Command?
To invoke the Profiler when running the flow using the broadway command, set the profilerTelemetry parameter to true. This will add the Profiler results to the command results.
fabric>broadway CRM.callGraphIt profilerTelemetry=true;
|column           |value                                                       |
+-----------------+------------------------------------------------------------+
|profilerTelemetry|callGraphIt 37ms
   Stage 1 6ms
      Http1 4ms
   Stage 2 18ms
      Http2 18ms|
(1 rows)
