


JMX Overview
What is JMX?
Fabric is tightly integrated with JMX (Java Management Extensions), a Java technology that enables monitoring and management of applications at runtime. JMX uses objects called MBeans (Managed Beans) to expose data and resources from the Fabric runtime.
What Can I Monitor with JMX?
The following categories of statistics are available through JMX:
- Processes — information about the major services running in Fabric during execution
- Actions — schema maintenance, Fabric commands, and deployment activity
- Transactions — Web Services statistics, GET performance, LUI queries, and LU population sync
- Resources — tasks, JDBC sessions, mDB sessions, and general system resource counts
- iidFinder — messages related to iidFinder queries and events
- Broadway flows — performance metrics per Flow, Stage, Actor, and Iteration
- Custom — statistics you have added to the JMX surface using the Fabric statistics API
Two Ways to Access JMX Data
JMX data can be accessed in two distinct ways, serving different purposes and used in different contexts.
1. The Fabric Statistics Page
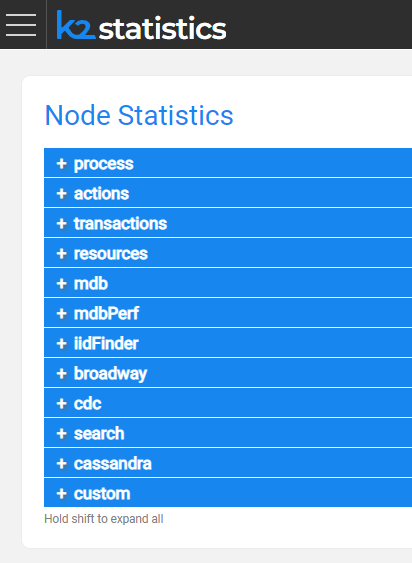
The Fabric Admin panel includes a Statistics page that provides a live, human-readable view of JMX counters. This is useful for development-time inspection and ad-hoc troubleshooting of a running Fabric instance.
To access it, select Statistics in the left panel. This view presents data in a tabular format suited for direct inspection but is not designed for automated collection, alerting, or long-term trending.
See JMX Format for a full description of what each statistics section contains.
2. The Prometheus HTTP Endpoint
For production monitoring, Fabric metrics are accessed through the Prometheus JMX Exporter, which K2view bundles with Fabric. The exporter reads the same JMX MBeans and serves them as a standard Prometheus-format HTTP endpoint at:
http://localhost:7170/metrics
This is the endpoint that Prometheus, Grafana Agent, and other compatible monitoring platforms scrape. It is the primary metrics path for production environments in both Kubernetes and VM / bare-metal deployments.
The exporter is included with Fabric and requires activation. How it is activated depends on your deployment model:
- Kubernetes (K2cloud SaaS / Self-hosted) — activation is managed by K2view through the K2cloud space profile. Recent profiles have monitoring enabled by default. Confirm with K2view that your space profile includes this setting. K2cloud Orchestrator injects the
MONITORING=defaultenvironment variable, which triggers the full monitor setup chain at container startup. - Kubernetes (Air-Gapped) — for customer-owned clusters without K2cloud Orchestrator, activation is manual. Set the
MONITORINGenvironment variable in the Fabric pod spec. See Fabric Monitoring in Air-Gapped Kubernetes Deployments. - VM / Bare-Metal — activation is manual, either by running
fabric_7_monitor.shor by adding the-javaagentline tojvm.optionsdirectly.
See How to Enable the JMX Exporter for Fabric for the full procedure.
Consuming JMX Metrics in External Platforms
Once the Prometheus endpoint is active, it can be consumed by any compatible monitoring platform:
- Prometheus + Grafana — the standard K2view monitoring stack. Prometheus scrapes the endpoint; Grafana visualizes the data.
- Grafana Agent — used in Kubernetes deployments as the cluster-local collector. Scrapes Fabric pods and remote-writes to Prometheus.
- Third-party platforms — such as Datadog, Dynatrace, Elastic, New Relic, and others that support Prometheus scraping — can consume the same endpoint without changes to Fabric. See How to Use the Shipped JMX Exporter with Third-Party Monitoring Platforms.
Further Reading
- JMX Format — the statistics sections available in the Fabric Admin panel and the Prometheus output format
- JMX Custom Statistics — how to add custom metrics to the JMX surface
- How to Enable the JMX Exporter for Fabric
- How to Verify That Fabric Is Exposing Metrics
- K2view Fabric Observability — Guide to the Documentation
JMX Overview
What is JMX?
Fabric is tightly integrated with JMX (Java Management Extensions), a Java technology that enables monitoring and management of applications at runtime. JMX uses objects called MBeans (Managed Beans) to expose data and resources from the Fabric runtime.
What Can I Monitor with JMX?
The following categories of statistics are available through JMX:
- Processes — information about the major services running in Fabric during execution
- Actions — schema maintenance, Fabric commands, and deployment activity
- Transactions — Web Services statistics, GET performance, LUI queries, and LU population sync
- Resources — tasks, JDBC sessions, mDB sessions, and general system resource counts
- iidFinder — messages related to iidFinder queries and events
- Broadway flows — performance metrics per Flow, Stage, Actor, and Iteration
- Custom — statistics you have added to the JMX surface using the Fabric statistics API
Two Ways to Access JMX Data
JMX data can be accessed in two distinct ways, serving different purposes and used in different contexts.
1. The Fabric Statistics Page
The Fabric Admin panel includes a Statistics page that provides a live, human-readable view of JMX counters. This is useful for development-time inspection and ad-hoc troubleshooting of a running Fabric instance.
To access it, select Statistics in the left panel. This view presents data in a tabular format suited for direct inspection but is not designed for automated collection, alerting, or long-term trending.
See JMX Format for a full description of what each statistics section contains.
2. The Prometheus HTTP Endpoint
For production monitoring, Fabric metrics are accessed through the Prometheus JMX Exporter, which K2view bundles with Fabric. The exporter reads the same JMX MBeans and serves them as a standard Prometheus-format HTTP endpoint at:
http://localhost:7170/metrics
This is the endpoint that Prometheus, Grafana Agent, and other compatible monitoring platforms scrape. It is the primary metrics path for production environments in both Kubernetes and VM / bare-metal deployments.
The exporter is included with Fabric and requires activation. How it is activated depends on your deployment model:
- Kubernetes (K2cloud SaaS / Self-hosted) — activation is managed by K2view through the K2cloud space profile. Recent profiles have monitoring enabled by default. Confirm with K2view that your space profile includes this setting. K2cloud Orchestrator injects the
MONITORING=defaultenvironment variable, which triggers the full monitor setup chain at container startup. - Kubernetes (Air-Gapped) — for customer-owned clusters without K2cloud Orchestrator, activation is manual. Set the
MONITORINGenvironment variable in the Fabric pod spec. See Fabric Monitoring in Air-Gapped Kubernetes Deployments. - VM / Bare-Metal — activation is manual, either by running
fabric_7_monitor.shor by adding the-javaagentline tojvm.optionsdirectly.
See How to Enable the JMX Exporter for Fabric for the full procedure.
Consuming JMX Metrics in External Platforms
Once the Prometheus endpoint is active, it can be consumed by any compatible monitoring platform:
- Prometheus + Grafana — the standard K2view monitoring stack. Prometheus scrapes the endpoint; Grafana visualizes the data.
- Grafana Agent — used in Kubernetes deployments as the cluster-local collector. Scrapes Fabric pods and remote-writes to Prometheus.
- Third-party platforms — such as Datadog, Dynatrace, Elastic, New Relic, and others that support Prometheus scraping — can consume the same endpoint without changes to Fabric. See How to Use the Shipped JMX Exporter with Third-Party Monitoring Platforms.
Further Reading
- JMX Format — the statistics sections available in the Fabric Admin panel and the Prometheus output format
- JMX Custom Statistics — how to add custom metrics to the JMX surface
- How to Enable the JMX Exporter for Fabric
- How to Verify That Fabric Is Exposing Metrics
- K2view Fabric Observability — Guide to the Documentation
