


Monitoring Dashboard Example
Deployment model: This dashboard example applies to VM and bare-metal deployments where Fabric, Cassandra, and Kafka run as native processes on virtual machines or physical servers. In Kubernetes deployments, the monitoring data sources, collection mechanisms, and dashboard structure differ. See K2view Kubernetes Monitoring Stack for Fabric for the Kubernetes equivalent.
Overview
The following example illustrates a reference Grafana dashboard configuration for monitoring K2view Fabric alongside supporting components such as Cassandra and Kafka. It is intended as a starting point that customers can extend and adapt to meet their specific operational and business requirements by adding relevant, project-specific metrics and panels. The dashboard combines metrics from two sources:
- JMX Exporter — Fabric and JVM metrics collected by Prometheus from each Fabric node at port 7170
- Node Exporter — host-level metrics (CPU, memory, disk, network) collected by Prometheus from each node at port 9100 Log panels draw from Loki, which receives log streams from Promtail running on each node. For setup instructions, see Monitoring Dashboard Example Setup. The dashboard JSON is available for download here for import into Grafana. Each panel in the dashboard includes descriptive metadata displayed as tooltips in the Grafana UI.
Prerequisites
Before importing the dashboard, confirm the following are in place:
- The JMX Exporter is active and
curl http://localhost:7170/metricsreturns Prometheus-format output on each Fabric node. See How to Enable the JMX Exporter for Fabric.- Prometheus is scraping both the JMX Exporter (port 7170) and Node Exporter (port 9100) on each relevant host. See How to Configure the Collection Layer to Scrape Fabric Metrics.
- Loki is receiving logs from Promtail on each node.
- Prometheus and Loki are both configured as data sources in Grafana.
Dashboard Panels
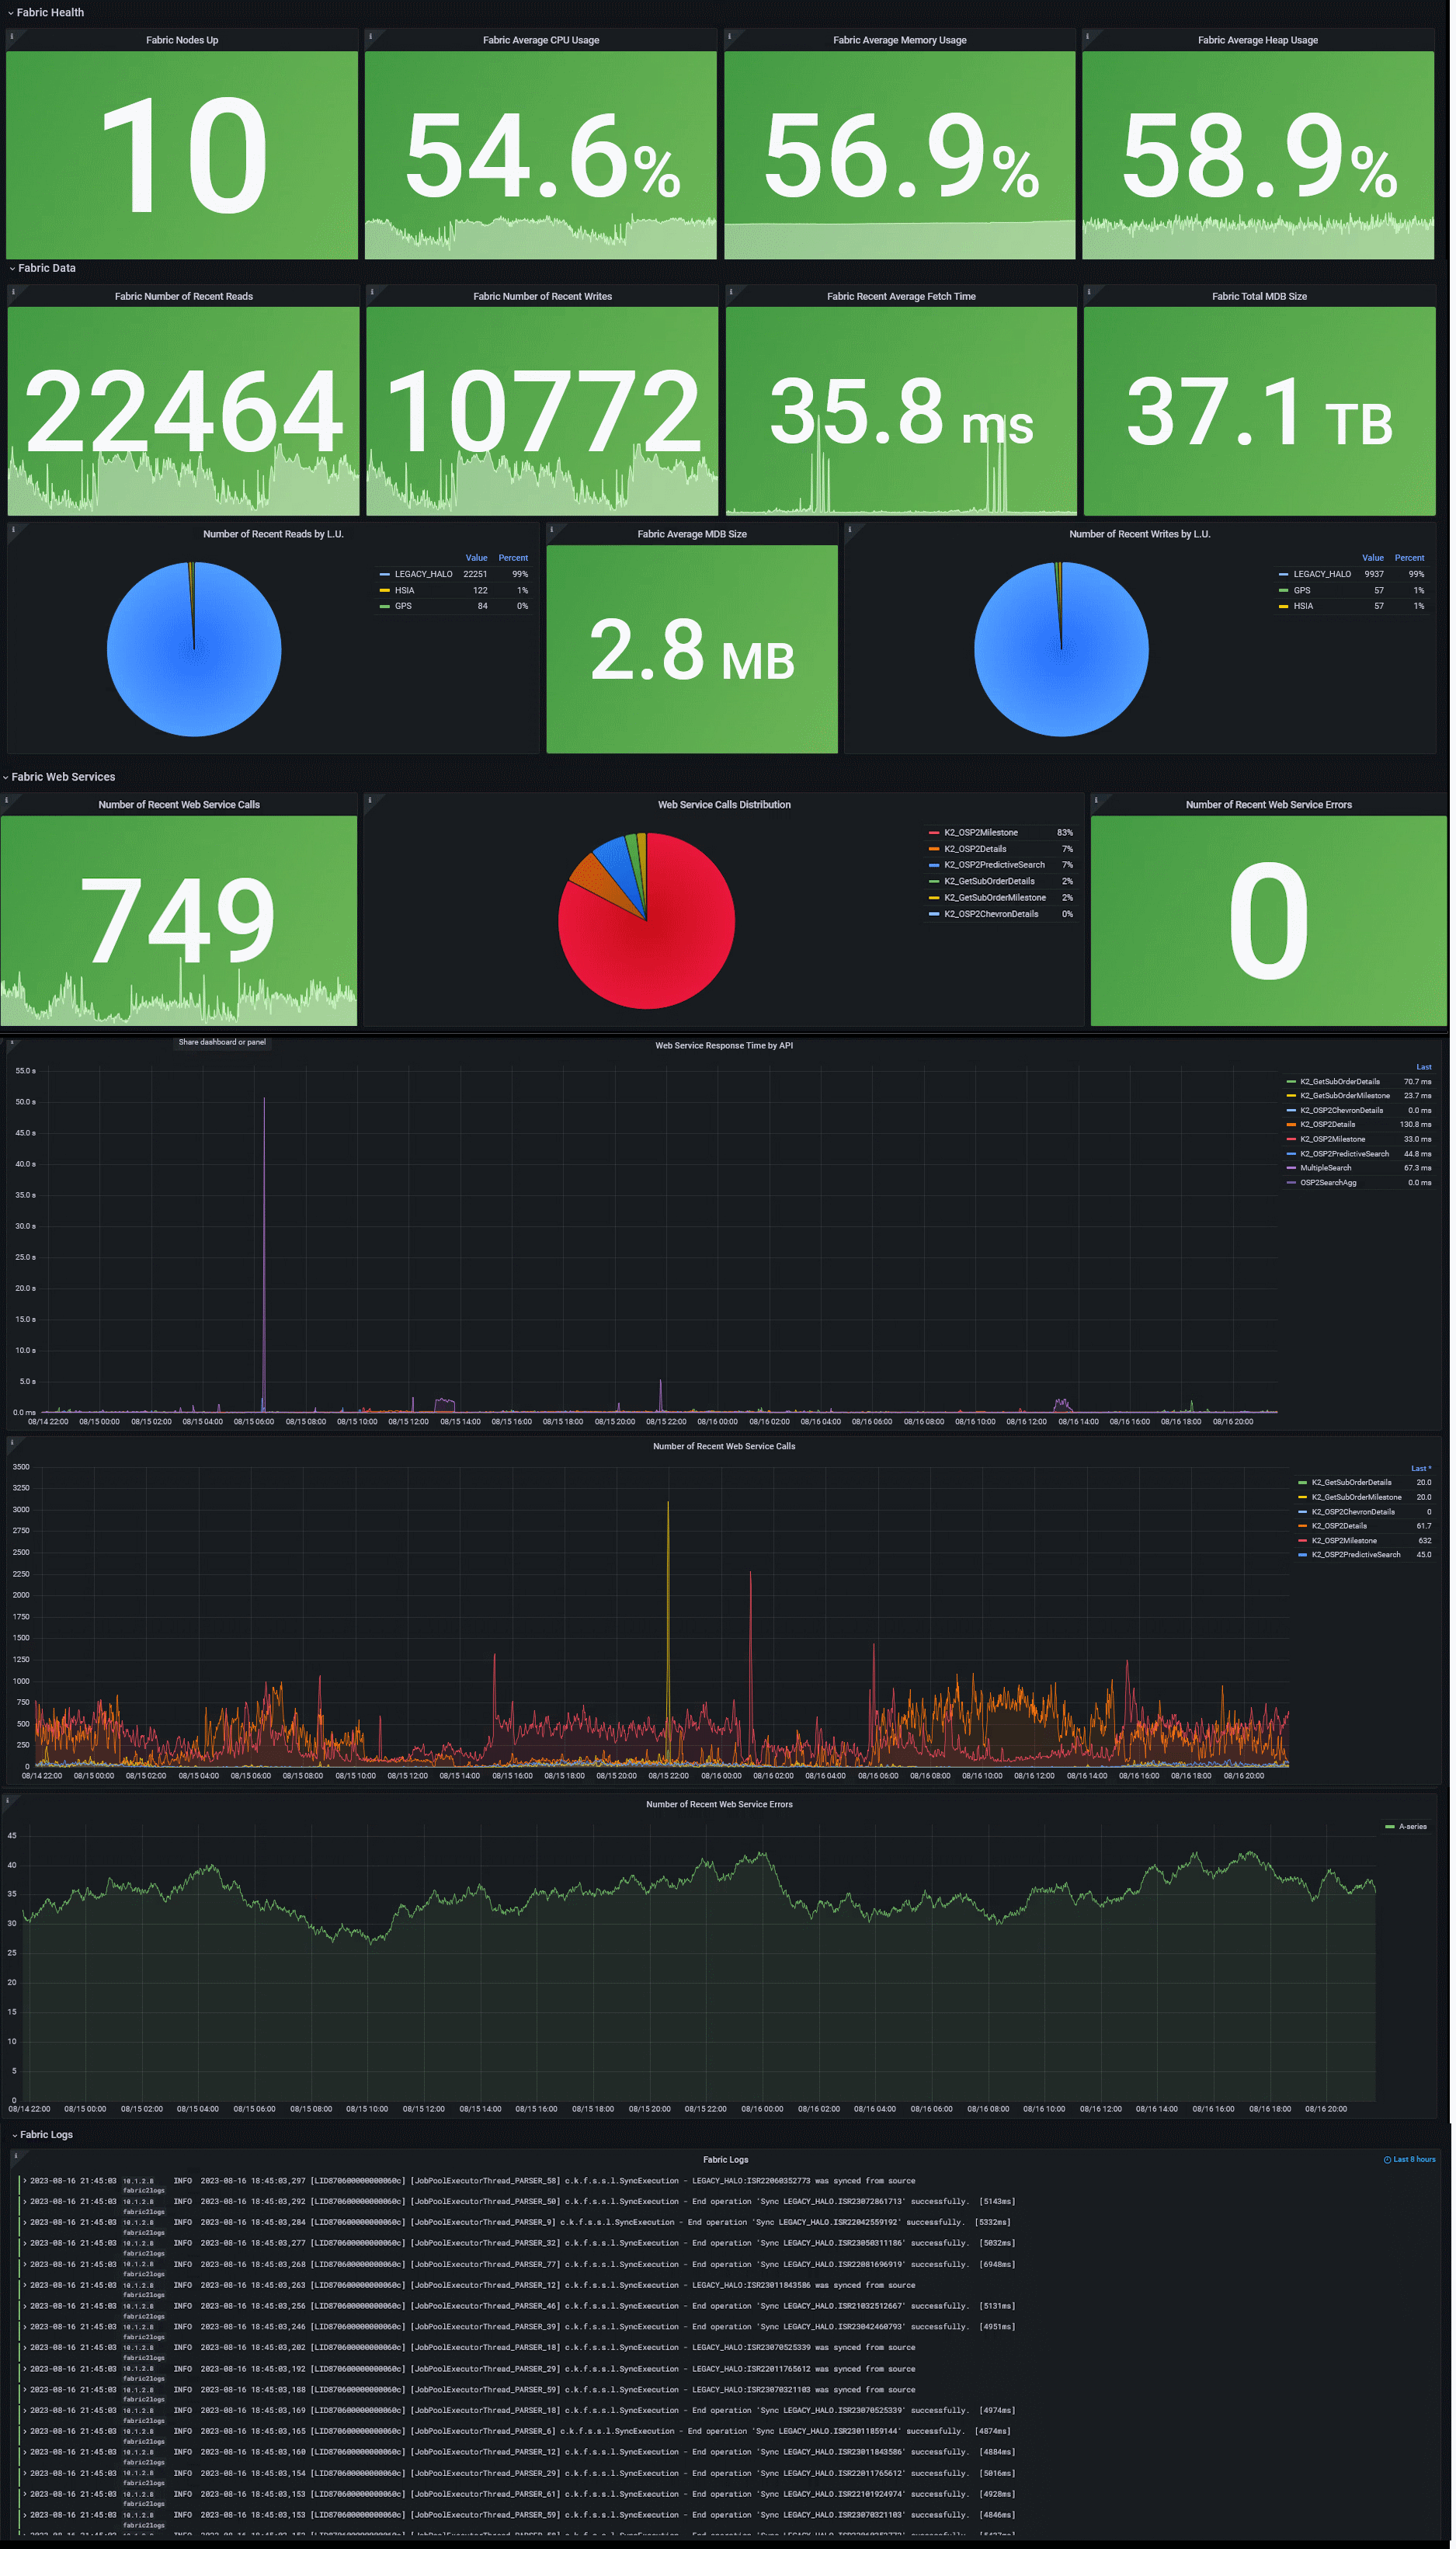
The dashboard is organized into sections covering Fabric, Cassandra, and Kafka. Each section has Health, Performance, and Logs panels. Panel data reflects the last 5 minutes by default — this window is configurable in Grafana. Here is an illustration of the dashboard layout (panel names may vary slightly from those in the JSON export file):
Fabric Health
Panels showing the current state of the Fabric cluster:
- Nodes Up — count of Fabric nodes currently active
- Average CPU Usage — average CPU utilization across Fabric nodes
- Average Memory Usage — average memory consumption across Fabric nodes
- Average Heap Usage — average JVM heap usage across Fabric nodes
Fabric Performance
Panels covering Fabric application throughput and API behavior:
- Reads Count — total read operations
- Writes Count — total write operations
- Average Read Time — mean duration of read operations
- Total mDB Size — aggregate size of all MicroDB instances
- Average mDB Size — mean MicroDB size per LUI
- Writes Count by LU — write operations broken down by Logical Unit
- Total API Calls Count — total Web Service calls received
- API Calls Distribution — breakdown of API calls by endpoint or method
- Failed API Calls Count — count of API calls that resulted in errors
- API Calls Avg. Response Time — mean Web Service response time
- API Calls Failures — failure rate and trend for Web Service calls
Fabric Logs
A log panel querying Loki for recent entries from the Fabric application log (
k2fabric.log), allowing operators to correlate metric anomalies with log evidence without leaving the dashboard.Cassandra Health
Equivalent health panels for Cassandra nodes (used when Cassandra is the system database):
- Nodes Up, Average CPU Usage, Average Memory Usage, Average Heap Usage
Cassandra Performance
- Disk Usage — storage consumption on Cassandra nodes
- Pending Top 5 Compactions — compaction queue depth, a key Cassandra health signal
Cassandra Logs
Log panel querying Loki for recent Cassandra log entries.
Kafka Health
Equivalent health panels for Kafka nodes:
- Nodes Up, Average CPU Usage, Average Memory Usage, Average Heap Usage
Kafka Performance
- Disk Usage — storage consumption on Kafka nodes
- Messages per Topic per Second — throughput by topic (only topics actively receiving messages are shown to avoid clutter)
Kafka Logs
Log panel querying Loki for recent Kafka log entries.
Variables
The dashboard includes a Variables section at the top that enables dynamic filtering — for example by environment (production, staging) — provided such metadata is present in the collected metrics as labels. Variables can be customized or hidden via:
- Grafana UI: Settings > Variables
- JSON: the
templatingsection of the dashboard JSON export This is useful when the same dashboard is used across multiple environments and you want to filter the view to a specific cluster, namespace, or node set.Extending the Dashboard
The reference dashboard is a starting point, not a finished product. Common extensions include:
- Adding panels for custom JMX statistics defined using the
statsCountandstatsDurationAPIs. See JMX Custom Statistics.- Adding alert rules on top of existing panels for key thresholds (heap usage, API error rate, node count)
- Adding panels for additional Fabric metrics exposed at
/metricsthat are not included in the reference dashboard. See JMX Format for the full list of available metric families.Further Reading
- Monitoring Dashboard Example Setup — step-by-step setup of Prometheus, Loki, Promtail, and Grafana for this dashboard
- How to Enable the JMX Exporter for Fabric
- How to Configure the Collection Layer to Scrape Fabric Metrics
- How to Control Metric Volume with Filtering and Relabeling
- JMX Custom Statistics
- K2view VM / Bare-Metal Monitoring Stack for Fabric
Monitoring Dashboard Example
Deployment model: This dashboard example applies to VM and bare-metal deployments where Fabric, Cassandra, and Kafka run as native processes on virtual machines or physical servers. In Kubernetes deployments, the monitoring data sources, collection mechanisms, and dashboard structure differ. See K2view Kubernetes Monitoring Stack for Fabric for the Kubernetes equivalent.
Overview
The following example illustrates a reference Grafana dashboard configuration for monitoring K2view Fabric alongside supporting components such as Cassandra and Kafka. It is intended as a starting point that customers can extend and adapt to meet their specific operational and business requirements by adding relevant, project-specific metrics and panels. The dashboard combines metrics from two sources:
- JMX Exporter — Fabric and JVM metrics collected by Prometheus from each Fabric node at port 7170
- Node Exporter — host-level metrics (CPU, memory, disk, network) collected by Prometheus from each node at port 9100 Log panels draw from Loki, which receives log streams from Promtail running on each node. For setup instructions, see Monitoring Dashboard Example Setup. The dashboard JSON is available for download here for import into Grafana. Each panel in the dashboard includes descriptive metadata displayed as tooltips in the Grafana UI.
Prerequisites
Before importing the dashboard, confirm the following are in place:
- The JMX Exporter is active and
curl http://localhost:7170/metricsreturns Prometheus-format output on each Fabric node. See How to Enable the JMX Exporter for Fabric.- Prometheus is scraping both the JMX Exporter (port 7170) and Node Exporter (port 9100) on each relevant host. See How to Configure the Collection Layer to Scrape Fabric Metrics.
- Loki is receiving logs from Promtail on each node.
- Prometheus and Loki are both configured as data sources in Grafana.
Dashboard Panels
The dashboard is organized into sections covering Fabric, Cassandra, and Kafka. Each section has Health, Performance, and Logs panels. Panel data reflects the last 5 minutes by default — this window is configurable in Grafana. Here is an illustration of the dashboard layout (panel names may vary slightly from those in the JSON export file):
Fabric Health
Panels showing the current state of the Fabric cluster:
- Nodes Up — count of Fabric nodes currently active
- Average CPU Usage — average CPU utilization across Fabric nodes
- Average Memory Usage — average memory consumption across Fabric nodes
- Average Heap Usage — average JVM heap usage across Fabric nodes
Fabric Performance
Panels covering Fabric application throughput and API behavior:
- Reads Count — total read operations
- Writes Count — total write operations
- Average Read Time — mean duration of read operations
- Total mDB Size — aggregate size of all MicroDB instances
- Average mDB Size — mean MicroDB size per LUI
- Writes Count by LU — write operations broken down by Logical Unit
- Total API Calls Count — total Web Service calls received
- API Calls Distribution — breakdown of API calls by endpoint or method
- Failed API Calls Count — count of API calls that resulted in errors
- API Calls Avg. Response Time — mean Web Service response time
- API Calls Failures — failure rate and trend for Web Service calls
Fabric Logs
A log panel querying Loki for recent entries from the Fabric application log (
k2fabric.log), allowing operators to correlate metric anomalies with log evidence without leaving the dashboard.Cassandra Health
Equivalent health panels for Cassandra nodes (used when Cassandra is the system database):
- Nodes Up, Average CPU Usage, Average Memory Usage, Average Heap Usage
Cassandra Performance
- Disk Usage — storage consumption on Cassandra nodes
- Pending Top 5 Compactions — compaction queue depth, a key Cassandra health signal
Cassandra Logs
Log panel querying Loki for recent Cassandra log entries.
Kafka Health
Equivalent health panels for Kafka nodes:
- Nodes Up, Average CPU Usage, Average Memory Usage, Average Heap Usage
Kafka Performance
- Disk Usage — storage consumption on Kafka nodes
- Messages per Topic per Second — throughput by topic (only topics actively receiving messages are shown to avoid clutter)
Kafka Logs
Log panel querying Loki for recent Kafka log entries.
Variables
The dashboard includes a Variables section at the top that enables dynamic filtering — for example by environment (production, staging) — provided such metadata is present in the collected metrics as labels. Variables can be customized or hidden via:
- Grafana UI: Settings > Variables
- JSON: the
templatingsection of the dashboard JSON export This is useful when the same dashboard is used across multiple environments and you want to filter the view to a specific cluster, namespace, or node set.Extending the Dashboard
The reference dashboard is a starting point, not a finished product. Common extensions include:
- Adding panels for custom JMX statistics defined using the
statsCountandstatsDurationAPIs. See JMX Custom Statistics.- Adding alert rules on top of existing panels for key thresholds (heap usage, API error rate, node count)
- Adding panels for additional Fabric metrics exposed at
/metricsthat are not included in the reference dashboard. See JMX Format for the full list of available metric families.Further Reading
- Monitoring Dashboard Example Setup — step-by-step setup of Prometheus, Loki, Promtail, and Grafana for this dashboard
- How to Enable the JMX Exporter for Fabric
- How to Configure the Collection Layer to Scrape Fabric Metrics
- How to Control Metric Volume with Filtering and Relabeling
- JMX Custom Statistics
- K2view VM / Bare-Metal Monitoring Stack for Fabric
