


K2view VM / Bare-Metal Monitoring Stack for Fabric
Reference architecture for Fabric, Node Exporter, Prometheus, Promtail, Loki, and Grafana on VM and bare-metal hosts
Table of Contents
- 1. Purpose
- 2. Scope
- 3. Solution Overview
- 4. Metrics Path Detail
- 5. Log Path Detail
- 6. Configuration Flow
- 7. Dashboard Model
- 8. What This Stack Achieves
- Appendix A: Key Ports
- Appendix B: Key Files
- Appendix C: Validation Checks
- Appendix D: Environment Variables
[ VM / Bare-Metal ] This entire document applies to VM and bare-metal deployments only. For Kubernetes deployments, see K2view Observability Architecture for Fabric.
1. Purpose
This document describes the K2view monitoring stack for Fabric deployed on virtual machines or bare-metal hosts. It explains how metrics and logs are collected, how the components work together, and how the sample Grafana dashboard presents a unified operational view of Fabric and its supporting infrastructure.
This document does not cover Kubernetes deployments. In Kubernetes, monitoring is enabled automatically through K2cloud Orchestrator and uses Grafana Agent as the local collector. On VMs and bare-metal hosts, the setup is performed manually or through the container startup scripts, and Prometheus scrapes directly using static targets.
2. Scope
This document covers:
The components that make up the VM / bare-metal monitoring stack
How metrics are collected from Fabric and the host
How logs are collected and shipped
How the monitoring setup is initialized on each Fabric host
Configuration examples for Prometheus, Loki, and Promtail
It does not cover:
Kubernetes deployments — see K2view Observability Architecture for Fabric
Thanos federation — Thanos is not part of the base VM / bare-metal model
Dashboard creation or alert rule configuration
Third-party monitoring platform integration
3. Solution Overview
The VM / bare-metal monitoring stack runs two parallel telemetry paths on each Fabric host: a metrics path and a log path.
3.1 Metrics Path
On each Fabric host:
The Prometheus JMX Exporter runs as a Java agent attached to the Fabric JVM. It reads JMX MBeans and serves Fabric and JVM metrics over HTTP at port 7170.
A separate JMX Exporter instance serves iid_finder metrics at port 7270.
Node Exporter runs as a background process on the same Fabric host and exposes operating system and hardware metrics.
On the monitoring machine:
Prometheus scrapes Fabric metrics and Node Exporter metrics from each Fabric host using static scrape targets.
Grafana queries Prometheus and presents metrics in dashboards.
3.2 Log Path
On each Fabric host:
Promtail runs as a background process and tails the Fabric log file.
Promtail pushes log streams to Loki on the monitoring machine.
Promtail only starts if the LOKI_HOST environment variable is set. If LOKI_HOST is not configured, log shipping is skipped silently.
On the monitoring machine:
Loki receives and indexes log streams from all Fabric hosts.
Grafana queries Loki for log panels, allowing operators to correlate metric anomalies with log evidence in the same dashboard.
3.3 Host Layout
A key distinction from the Kubernetes model: on VMs, Node Exporter and Promtail run on the same host as Fabric, not on separate machines. All three processes (JMX Exporter via the Fabric JVM, Node Exporter, and Promtail) are started by the monitor_setup.sh script on each Fabric host.
The monitoring machine is separate and runs Prometheus, Loki, and Grafana.
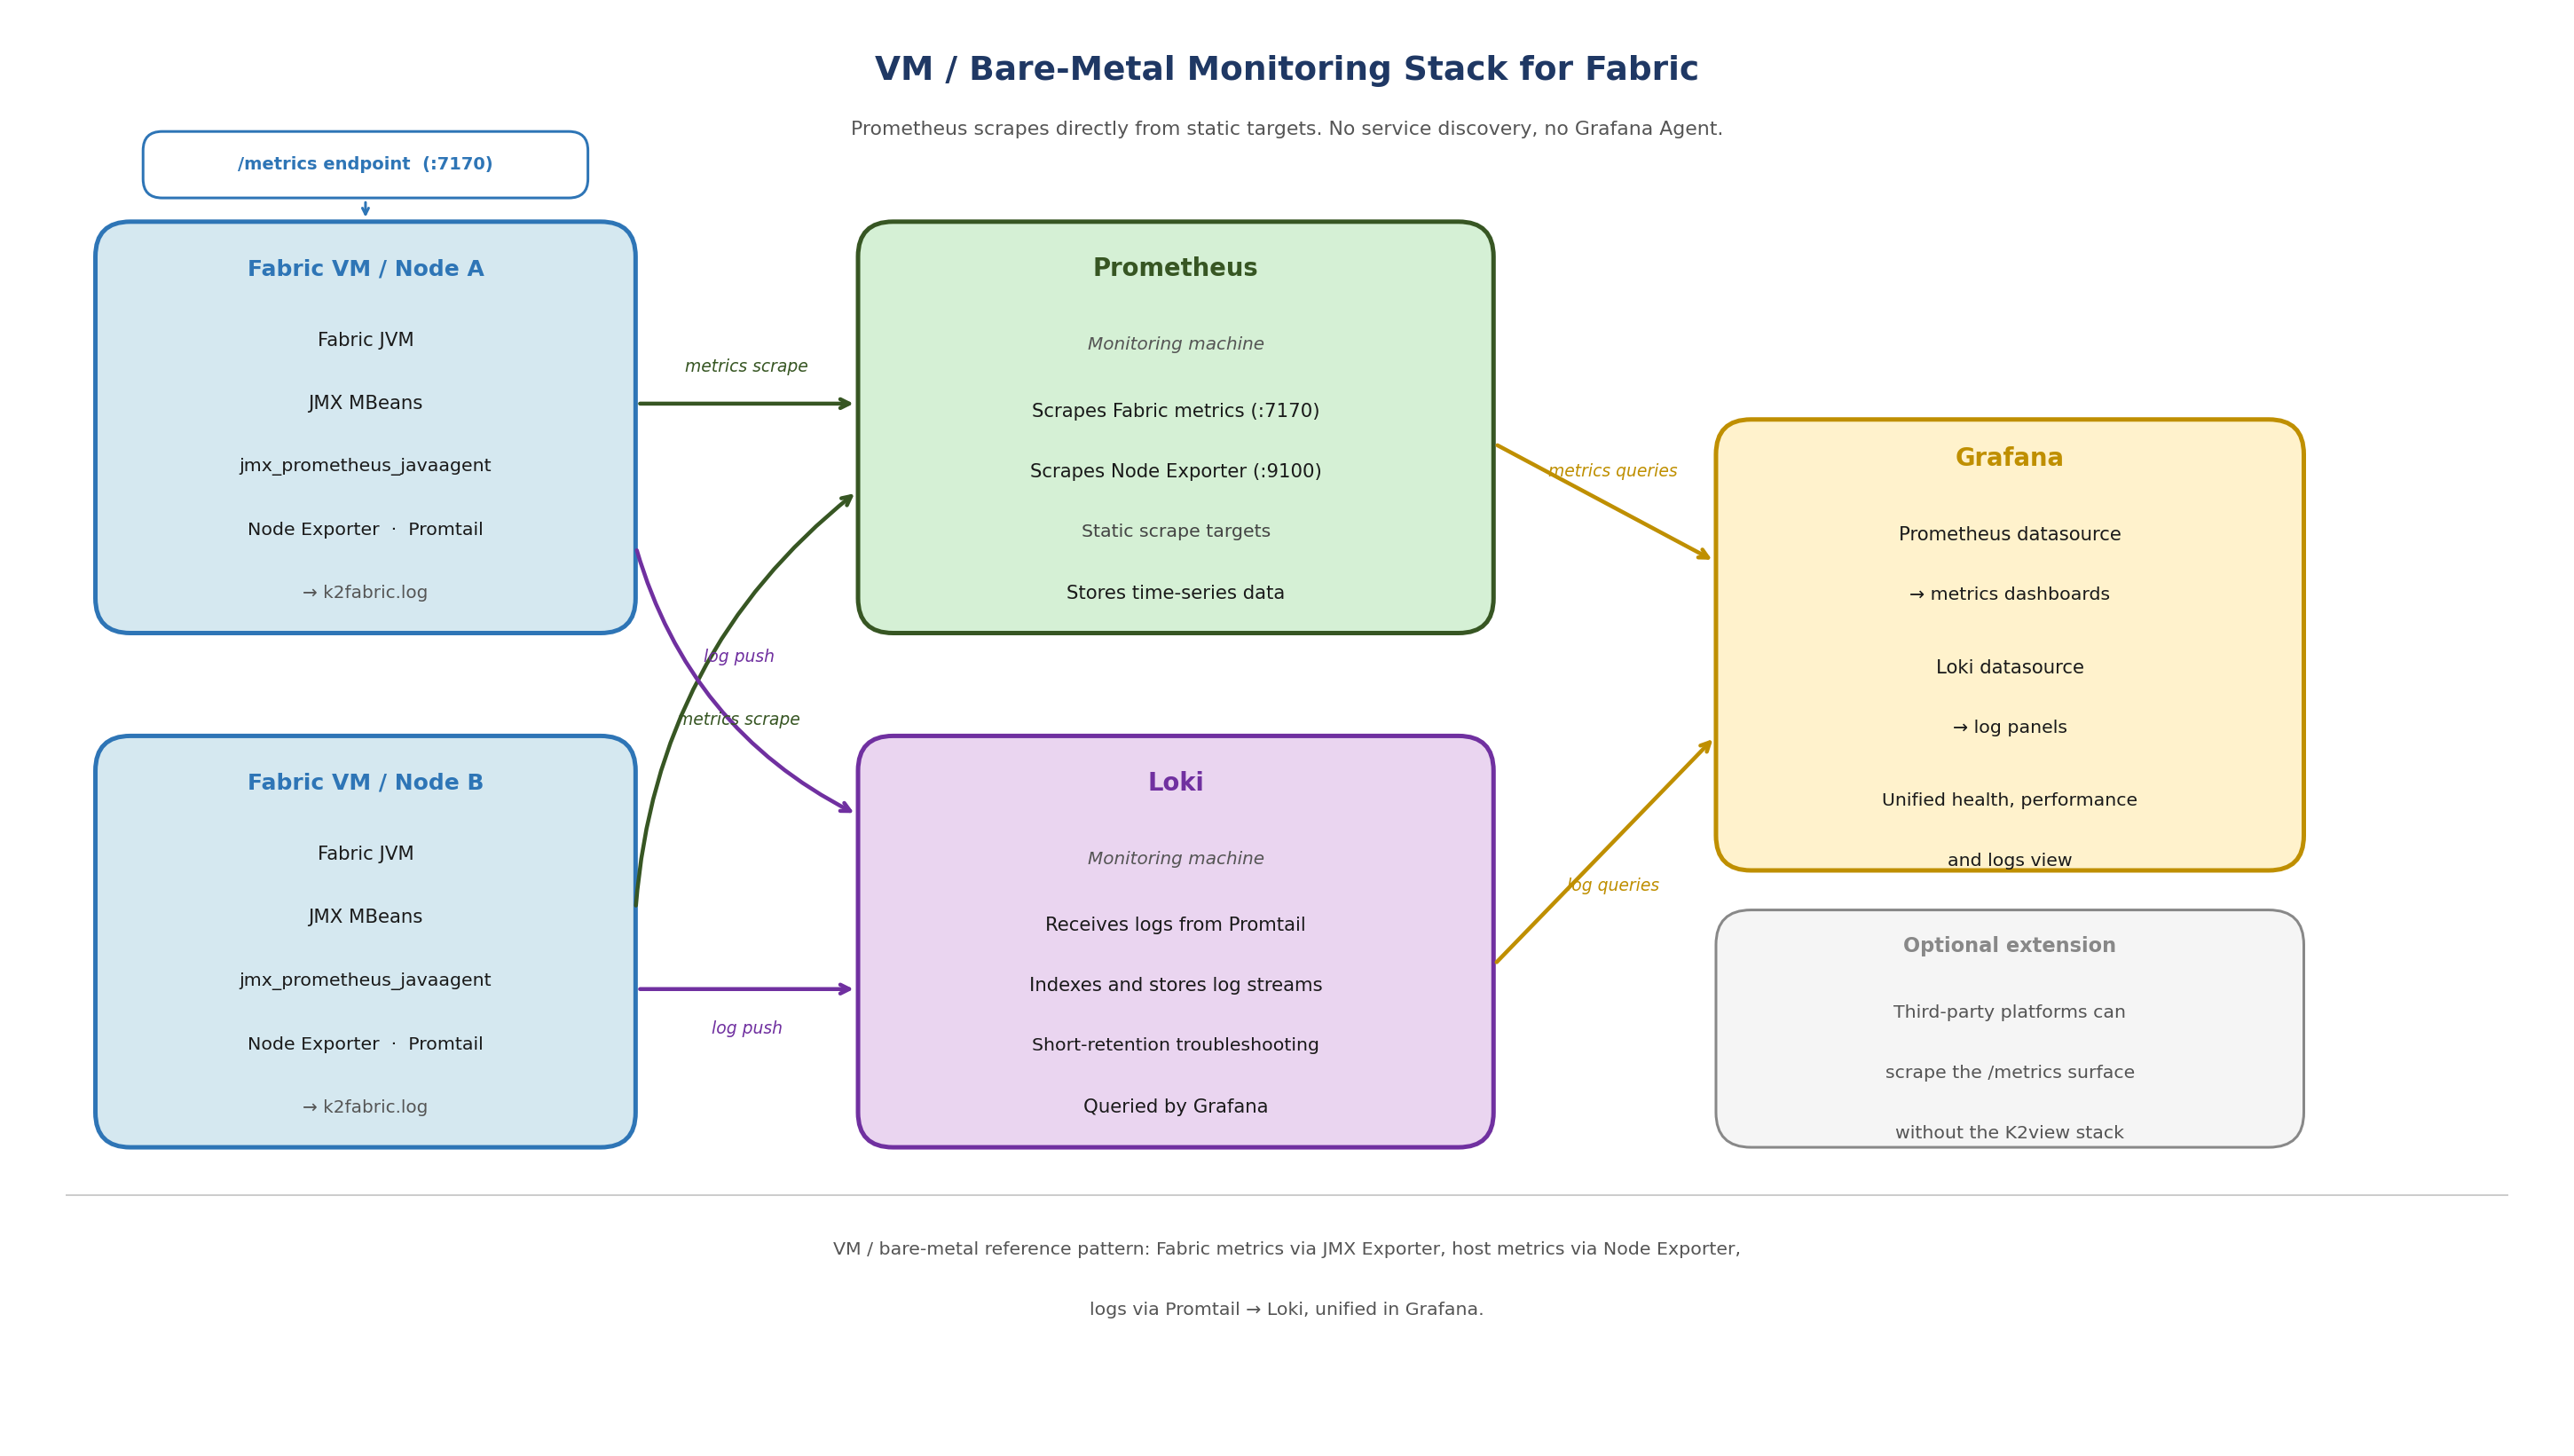
[Figure 1 — VM / Bare-Metal Monitoring Stack for Fabric]
Figure 1. VM / bare-metal reference pattern: Fabric metrics via JMX Exporter, host metrics via Node Exporter, logs via Promtail to Loki, unified in Grafana.
Fabric JVM + JMX Exporter (:7170)
iid_finder JVM + JMX Exporter (:7270)
Node Exporter (background process)
Promtail (background process) ──────────────► Loki (monitoring machine)
│
└── metrics scraped by Prometheus (monitoring machine)
4. Metrics Path Detail
4.1 JMX Exporter
The Prometheus JMX Exporter is bundled with Fabric under the monitor directory:
$K2_HOME/monitor/jmx_exporter/
jmx_prometheus_javaagent-1.5.0.jar
fabric_config.yaml # Fabric exporter configuration
iidfinder_config.yaml # iid_finder exporter configuration
The exporter runs as a Java agent attached to the Fabric JVM. It reads JMX MBeans from the running Fabric process and exposes them as Prometheus-format metrics over HTTP.
Once active, the endpoints are:
http://localhost:7170/metrics # Fabric JVM and application metrics
http://localhost:7270/metrics # iid_finder metrics
The exporter configuration (fabric_config.yaml) is intentionally minimal. Fabric exposes all metrics it can expose by default. Filtering is applied in Prometheus, not in the exporter.
4.2 How the JMX Exporter is Activated
The JMX Exporter is activated by appending a -javaagent line to jvm.options. This line does not pre-exist in jvm.options — it is written at setup time.
There are two ways to activate it on a VM:
Option A — Run the monitor setup script
If the monitor directory is present on the Fabric host, run:
$K2_HOME/monitor/jmx_exporter/fabric_7_monitor.sh
This script:
Checks whether the javaagent line is already present in jvm.options (idempotent — safe to run more than once)
Appends the javaagent line for Fabric at port 7170 if not present
Appends the javaagent line for iid_finder at port 7270 if not present
Enables JMX remote management settings in jvm.options
Sets file permissions on JMX credential files
The line appended to jvm.options is:
-javaagent:$K2_HOME/monitor/jmx_exporter/jmx_prometheus_javaagent-1.5.0.jar=7170:$K2_HOME/monitor/jmx_exporter/fabric_config.yaml
Option B — Edit jvm.options manually
Add the following line to $K2_HOME/config/jvm.options:
-javaagent:$K2_HOME/monitor/jmx_exporter/jmx_prometheus_javaagent-1.5.0.jar=7170:$K2_HOME/monitor/jmx_exporter/fabric_config.yaml
Note: Fabric must be restarted after either option for the javaagent line to take effect. The exporter is loaded at JVM startup — changes to jvm.options have no effect on a running Fabric process.
4.3 Node Exporter
Node Exporter runs on the Fabric host as a background process started by monitor_setup.sh. It exposes operating system and hardware metrics including CPU usage, memory pressure, filesystem consumption, network activity, and kernel counters.
Node Exporter runs on the same host as Fabric. It is not a separate machine and not a Kubernetes DaemonSet. In the VM model, one Node Exporter instance runs per Fabric host.
Node Exporter exposes metrics at the default port:
http://localhost:9100/metrics
4.4 monitor_setup.sh
The monitor_setup.sh script orchestrates the full monitor initialization on a Fabric host. It performs three steps in sequence:
setup_monitor: copies the monitor directory from the Fabric image to $FABRIC_HOME (persistent volume) if not already present
init_monitor: calls fabric_7_monitor.sh to configure jvm.options, and calls promtail_config.sh if LOKI_HOST is set
start_monitor: starts Node Exporter and Promtail as background processes, if the monitor directory is present and MONITORING is not set to NONE
On a host where Fabric runs as a container (even in a non-Kubernetes context), monitor_setup.sh is called automatically at container startup when the MONITORING environment variable is set to 'default' or 'true'. On a native bare-metal installation without containerization, the script can be run manually.
4.5 Prometheus Scrape Configuration
Prometheus runs on a dedicated monitoring machine and scrapes all Fabric hosts using static targets. Unlike the Kubernetes model, there is no service discovery. Each Fabric host must be explicitly listed.
A representative scrape configuration:
scrape_configs:
   - job_name: fabric-jmx
     metrics_path: /metrics
     static_configs:
       - targets:
          - <FABRIC_HOST_1>:7170
          - <FABRIC_HOST_2>:7170

   - job_name: node-exporter
     metrics_path: /metrics
     static_configs:
       - targets:
           - <FABRIC_HOST_1>:9100
           - <FABRIC_HOST_2>:9100
Note: Replace
After adding or updating scrape targets, reload Prometheus:
curl -X POST http://localhost:9090/-/reload
Then confirm the targets are visible and healthy in the Prometheus Targets UI.
5. Log Path Detail
5.1 Promtail
Promtail runs on each Fabric host as a background process started by monitor_setup.sh. It tails the Fabric log file and pushes log streams to Loki.
The Fabric log file tailed by Promtail is:
$K2_HOME/logs/k2fabric.log
Promtail is configured at startup by promtail_config.sh, which substitutes the Loki host, hostname, and log path into the configuration template. Promtail only starts if the LOKI_HOST environment variable is set. If LOKI_HOST is not set, Promtail is skipped and no logs are shipped.
5.2 Promtail Configuration
A representative Promtail configuration for a Fabric host is shown below. Replace placeholder values with your actual Loki endpoint and host details.
server:
   http_listen_port: 9080
   grpc_listen_port: 0
positions:
   filename: /tmp/positions.yaml
clients:
   - url: http://<LOKI_HOST>:3100/loki/api/v1/push

scrape_configs:
   - job_name: fabric
     static_configs:
       - targets:
          - localhost
         labels:
           job: fabriclogs
           App: fabric
           host: <FABRIC_HOST_NAME>
           __path__: /opt/apps/fabric/workspace/logs/k2f*.log
   - job_name: iidfinder
     static_configs:
       - targets:
           - localhost
         labels:
           job: iidfinderlogs
           app: iidfinder
           host: <FABRIC_HOST_NAME>
           __path__: /opt/apps/fabric/workspace/logs/iid*.log
Note: Replace
5.3 Loki
Loki runs on the monitoring machine and receives log streams pushed by Promtail instances on each Fabric host. It indexes and stores log streams for querying through Grafana.
A representative Loki configuration for a VM deployment:
auth_enabled: false

server:
   http_listen_port: 3100

common:
   path_prefix: /tmp/loki
   storage:
   filesystem:
      chunks_directory: /opt/apps/monitor/storage/loki/data/chunks
      rules_directory: /opt/apps/monitor/loki/rules
   replication_factor: 1
   ring:
      instance_addr: 127.0.0.1
      kvstore:
         store: inmemory

limits_config:
   retention_period: 72h
Note: The retention_period of 72h is a representative starting point. Adjust based on your storage capacity and troubleshooting requirements.
6. Configuration Flow
The following sequence describes the full setup for each Fabric host and the monitoring machine.
6.1 On Each Fabric Host
Run fabric_7_monitor.sh (or edit jvm.options manually) to add the javaagent line.
Restart Fabric so the JVM picks up the new javaagent line.
Confirm the Fabric metrics endpoint is responding:
curl http://localhost:7170/metrics
- Start Node Exporter as a background process:
nohup $K2_HOME/monitor/node_exporter/node_exporter >/dev/null 2>&1 &
- Configure and start Promtail (if Loki is available):
$K2_HOME/monitor/promtail/promtail_config.sh -lk <LOKI_HOST> -s fabric
Alternatively: If the monitor directory is present and the MONITORING environment variable is set to 'default' or 'true', running monitor_setup.sh performs all of the above steps automatically.
6.2 On the Monitoring Machine
Start Loki with the local configuration file.
Configure Prometheus with scrape jobs for each Fabric host (port 7170) and Node Exporter (port 9100).
Start or reload Prometheus.
Configure Grafana with Prometheus and Loki as data sources.
Import the Grafana dashboard JSON.
7. Dashboard Model
The sample Grafana dashboard is organized around Fabric, Cassandra, and Kafka. It combines JVM metrics, Fabric product counters, and Node Exporter host metrics to provide a unified operational view.
The dashboard is divided into sections:
Fabric Health: nodes up, CPU usage, memory usage, heap usage
Fabric Performance: reads, writes, read time, mDB size
JVM: GC activity, thread counts, heap and non-heap memory
Host: CPU, memory, filesystem, network (from Node Exporter)
Logs: Fabric log panel querying Loki
This structure allows operators to move from a product-level symptom to a platform-level cause without leaving the dashboard context. For example, elevated read latency in Fabric can be correlated with host CPU saturation or memory pressure in the same view.
The dashboard JSON and setup instructions are available in the K2view Academy:
Monitoring Dashboard Example
Monitoring Dashboard Example Setup
8. What This Stack Achieves
The VM / bare-metal monitoring stack provides visibility into:
Fabric runtime health and application behavior — from the JMX Exporter
JVM condition — memory, GC, threads, heap — from the JMX Exporter
Host-level resource usage — CPU, memory, disk, network — from Node Exporter
Fabric log output — from Promtail and Loki
All four data types are presented together in Grafana. This supports the key operational questions: Is Fabric up? Is the JVM under pressure? Is the host overloaded? What did the application log when a problem occurred?
Appendix A: Key Ports
7170 — Fabric JMX Exporter (/metrics)
7270 — iid_finder JMX Exporter (/metrics)
9100 — Node Exporter (/metrics)
9080 — Promtail HTTP server
3100 — Loki push endpoint and query API
9090 — Prometheus
3000 — Grafana
Appendix B: Key Files
$K2_HOME/monitor/jmx_exporter/jmx_prometheus_javaagent-1.5.0.jar — JMX Exporter JAR
$K2_HOME/monitor/jmx_exporter/fabric_config.yaml — Fabric exporter config
$K2_HOME/monitor/jmx_exporter/iidfinder_config.yaml — iid_finder exporter config
$K2_HOME/monitor/jmx_exporter/fabric_7_monitor.sh — configures jvm.options and enables JMX
$K2_HOME/monitor/node_exporter/node_exporter — Node Exporter binary
$K2_HOME/monitor/promtail/promtail_config.sh — configures and starts Promtail
$K2_HOME/monitor/promtail/promtail-fabric-config.yaml — Promtail config template
$K2_HOME/config/jvm.options — Fabric JVM options (javaagent line is appended here)
Appendix C: Validation Checks
Fabric metrics endpoint:
curl http://localhost:7170/metrics
iid_finder metrics endpoint:
curl http://localhost:7270/metrics
Node Exporter metrics endpoint:
curl http://localhost:9100/metrics
Prometheus targets (from monitoring machine):
curl http://<MONITORING_MACHINE>:9090/api/v1/targets
Appendix D: Environment Variables
MONITORING — Controls whether the monitoring stack is initialized. Set to 'default' or 'true' to enable. Set to 'NONE' to suppress. If unset, monitoring is not started.
LOKI_HOST — The hostname or IP address of the Loki server. Promtail only starts if this variable is set.
Security note: The fabric_config.yaml file contains default JMX credentials (username and password). Review and update these for production deployments.
K2view VM / Bare-Metal Monitoring Stack for Fabric
Reference architecture for Fabric, Node Exporter, Prometheus, Promtail, Loki, and Grafana on VM and bare-metal hosts
Table of Contents
- 1. Purpose
- 2. Scope
- 3. Solution Overview
- 4. Metrics Path Detail
- 5. Log Path Detail
- 6. Configuration Flow
- 7. Dashboard Model
- 8. What This Stack Achieves
- Appendix A: Key Ports
- Appendix B: Key Files
- Appendix C: Validation Checks
- Appendix D: Environment Variables
[ VM / Bare-Metal ] This entire document applies to VM and bare-metal deployments only. For Kubernetes deployments, see K2view Observability Architecture for Fabric.
1. Purpose
This document describes the K2view monitoring stack for Fabric deployed on virtual machines or bare-metal hosts. It explains how metrics and logs are collected, how the components work together, and how the sample Grafana dashboard presents a unified operational view of Fabric and its supporting infrastructure.
This document does not cover Kubernetes deployments. In Kubernetes, monitoring is enabled automatically through K2cloud Orchestrator and uses Grafana Agent as the local collector. On VMs and bare-metal hosts, the setup is performed manually or through the container startup scripts, and Prometheus scrapes directly using static targets.
2. Scope
This document covers:
The components that make up the VM / bare-metal monitoring stack
How metrics are collected from Fabric and the host
How logs are collected and shipped
How the monitoring setup is initialized on each Fabric host
Configuration examples for Prometheus, Loki, and Promtail
It does not cover:
Kubernetes deployments — see K2view Observability Architecture for Fabric
Thanos federation — Thanos is not part of the base VM / bare-metal model
Dashboard creation or alert rule configuration
Third-party monitoring platform integration
3. Solution Overview
The VM / bare-metal monitoring stack runs two parallel telemetry paths on each Fabric host: a metrics path and a log path.
3.1 Metrics Path
On each Fabric host:
The Prometheus JMX Exporter runs as a Java agent attached to the Fabric JVM. It reads JMX MBeans and serves Fabric and JVM metrics over HTTP at port 7170.
A separate JMX Exporter instance serves iid_finder metrics at port 7270.
Node Exporter runs as a background process on the same Fabric host and exposes operating system and hardware metrics.
On the monitoring machine:
Prometheus scrapes Fabric metrics and Node Exporter metrics from each Fabric host using static scrape targets.
Grafana queries Prometheus and presents metrics in dashboards.
3.2 Log Path
On each Fabric host:
Promtail runs as a background process and tails the Fabric log file.
Promtail pushes log streams to Loki on the monitoring machine.
Promtail only starts if the LOKI_HOST environment variable is set. If LOKI_HOST is not configured, log shipping is skipped silently.
On the monitoring machine:
Loki receives and indexes log streams from all Fabric hosts.
Grafana queries Loki for log panels, allowing operators to correlate metric anomalies with log evidence in the same dashboard.
3.3 Host Layout
A key distinction from the Kubernetes model: on VMs, Node Exporter and Promtail run on the same host as Fabric, not on separate machines. All three processes (JMX Exporter via the Fabric JVM, Node Exporter, and Promtail) are started by the monitor_setup.sh script on each Fabric host.
The monitoring machine is separate and runs Prometheus, Loki, and Grafana.
[Figure 1 — VM / Bare-Metal Monitoring Stack for Fabric]
Figure 1. VM / bare-metal reference pattern: Fabric metrics via JMX Exporter, host metrics via Node Exporter, logs via Promtail to Loki, unified in Grafana.
Fabric JVM + JMX Exporter (:7170)
iid_finder JVM + JMX Exporter (:7270)
Node Exporter (background process)
Promtail (background process) ──────────────► Loki (monitoring machine)
│
└── metrics scraped by Prometheus (monitoring machine)
4. Metrics Path Detail
4.1 JMX Exporter
The Prometheus JMX Exporter is bundled with Fabric under the monitor directory:
$K2_HOME/monitor/jmx_exporter/
jmx_prometheus_javaagent-1.5.0.jar
fabric_config.yaml # Fabric exporter configuration
iidfinder_config.yaml # iid_finder exporter configuration
The exporter runs as a Java agent attached to the Fabric JVM. It reads JMX MBeans from the running Fabric process and exposes them as Prometheus-format metrics over HTTP.
Once active, the endpoints are:
http://localhost:7170/metrics # Fabric JVM and application metrics
http://localhost:7270/metrics # iid_finder metrics
The exporter configuration (fabric_config.yaml) is intentionally minimal. Fabric exposes all metrics it can expose by default. Filtering is applied in Prometheus, not in the exporter.
4.2 How the JMX Exporter is Activated
The JMX Exporter is activated by appending a -javaagent line to jvm.options. This line does not pre-exist in jvm.options — it is written at setup time.
There are two ways to activate it on a VM:
Option A — Run the monitor setup script
If the monitor directory is present on the Fabric host, run:
$K2_HOME/monitor/jmx_exporter/fabric_7_monitor.sh
This script:
Checks whether the javaagent line is already present in jvm.options (idempotent — safe to run more than once)
Appends the javaagent line for Fabric at port 7170 if not present
Appends the javaagent line for iid_finder at port 7270 if not present
Enables JMX remote management settings in jvm.options
Sets file permissions on JMX credential files
The line appended to jvm.options is:
-javaagent:$K2_HOME/monitor/jmx_exporter/jmx_prometheus_javaagent-1.5.0.jar=7170:$K2_HOME/monitor/jmx_exporter/fabric_config.yaml
Option B — Edit jvm.options manually
Add the following line to $K2_HOME/config/jvm.options:
-javaagent:$K2_HOME/monitor/jmx_exporter/jmx_prometheus_javaagent-1.5.0.jar=7170:$K2_HOME/monitor/jmx_exporter/fabric_config.yaml
Note: Fabric must be restarted after either option for the javaagent line to take effect. The exporter is loaded at JVM startup — changes to jvm.options have no effect on a running Fabric process.
4.3 Node Exporter
Node Exporter runs on the Fabric host as a background process started by monitor_setup.sh. It exposes operating system and hardware metrics including CPU usage, memory pressure, filesystem consumption, network activity, and kernel counters.
Node Exporter runs on the same host as Fabric. It is not a separate machine and not a Kubernetes DaemonSet. In the VM model, one Node Exporter instance runs per Fabric host.
Node Exporter exposes metrics at the default port:
http://localhost:9100/metrics
4.4 monitor_setup.sh
The monitor_setup.sh script orchestrates the full monitor initialization on a Fabric host. It performs three steps in sequence:
setup_monitor: copies the monitor directory from the Fabric image to $FABRIC_HOME (persistent volume) if not already present
init_monitor: calls fabric_7_monitor.sh to configure jvm.options, and calls promtail_config.sh if LOKI_HOST is set
start_monitor: starts Node Exporter and Promtail as background processes, if the monitor directory is present and MONITORING is not set to NONE
On a host where Fabric runs as a container (even in a non-Kubernetes context), monitor_setup.sh is called automatically at container startup when the MONITORING environment variable is set to 'default' or 'true'. On a native bare-metal installation without containerization, the script can be run manually.
4.5 Prometheus Scrape Configuration
Prometheus runs on a dedicated monitoring machine and scrapes all Fabric hosts using static targets. Unlike the Kubernetes model, there is no service discovery. Each Fabric host must be explicitly listed.
A representative scrape configuration:
scrape_configs:
   - job_name: fabric-jmx
     metrics_path: /metrics
     static_configs:
       - targets:
          - <FABRIC_HOST_1>:7170
          - <FABRIC_HOST_2>:7170

   - job_name: node-exporter
     metrics_path: /metrics
     static_configs:
       - targets:
           - <FABRIC_HOST_1>:9100
           - <FABRIC_HOST_2>:9100
Note: Replace
After adding or updating scrape targets, reload Prometheus:
curl -X POST http://localhost:9090/-/reload
Then confirm the targets are visible and healthy in the Prometheus Targets UI.
5. Log Path Detail
5.1 Promtail
Promtail runs on each Fabric host as a background process started by monitor_setup.sh. It tails the Fabric log file and pushes log streams to Loki.
The Fabric log file tailed by Promtail is:
$K2_HOME/logs/k2fabric.log
Promtail is configured at startup by promtail_config.sh, which substitutes the Loki host, hostname, and log path into the configuration template. Promtail only starts if the LOKI_HOST environment variable is set. If LOKI_HOST is not set, Promtail is skipped and no logs are shipped.
5.2 Promtail Configuration
A representative Promtail configuration for a Fabric host is shown below. Replace placeholder values with your actual Loki endpoint and host details.
server:
   http_listen_port: 9080
   grpc_listen_port: 0
positions:
   filename: /tmp/positions.yaml
clients:
   - url: http://<LOKI_HOST>:3100/loki/api/v1/push

scrape_configs:
   - job_name: fabric
     static_configs:
       - targets:
          - localhost
         labels:
           job: fabriclogs
           App: fabric
           host: <FABRIC_HOST_NAME>
           __path__: /opt/apps/fabric/workspace/logs/k2f*.log
   - job_name: iidfinder
     static_configs:
       - targets:
           - localhost
         labels:
           job: iidfinderlogs
           app: iidfinder
           host: <FABRIC_HOST_NAME>
           __path__: /opt/apps/fabric/workspace/logs/iid*.log
Note: Replace
5.3 Loki
Loki runs on the monitoring machine and receives log streams pushed by Promtail instances on each Fabric host. It indexes and stores log streams for querying through Grafana.
A representative Loki configuration for a VM deployment:
auth_enabled: false

server:
   http_listen_port: 3100

common:
   path_prefix: /tmp/loki
   storage:
   filesystem:
      chunks_directory: /opt/apps/monitor/storage/loki/data/chunks
      rules_directory: /opt/apps/monitor/loki/rules
   replication_factor: 1
   ring:
      instance_addr: 127.0.0.1
      kvstore:
         store: inmemory

limits_config:
   retention_period: 72h
Note: The retention_period of 72h is a representative starting point. Adjust based on your storage capacity and troubleshooting requirements.
6. Configuration Flow
The following sequence describes the full setup for each Fabric host and the monitoring machine.
6.1 On Each Fabric Host
Run fabric_7_monitor.sh (or edit jvm.options manually) to add the javaagent line.
Restart Fabric so the JVM picks up the new javaagent line.
Confirm the Fabric metrics endpoint is responding:
curl http://localhost:7170/metrics
- Start Node Exporter as a background process:
nohup $K2_HOME/monitor/node_exporter/node_exporter >/dev/null 2>&1 &
- Configure and start Promtail (if Loki is available):
$K2_HOME/monitor/promtail/promtail_config.sh -lk <LOKI_HOST> -s fabric
Alternatively: If the monitor directory is present and the MONITORING environment variable is set to 'default' or 'true', running monitor_setup.sh performs all of the above steps automatically.
6.2 On the Monitoring Machine
Start Loki with the local configuration file.
Configure Prometheus with scrape jobs for each Fabric host (port 7170) and Node Exporter (port 9100).
Start or reload Prometheus.
Configure Grafana with Prometheus and Loki as data sources.
Import the Grafana dashboard JSON.
7. Dashboard Model
The sample Grafana dashboard is organized around Fabric, Cassandra, and Kafka. It combines JVM metrics, Fabric product counters, and Node Exporter host metrics to provide a unified operational view.
The dashboard is divided into sections:
Fabric Health: nodes up, CPU usage, memory usage, heap usage
Fabric Performance: reads, writes, read time, mDB size
JVM: GC activity, thread counts, heap and non-heap memory
Host: CPU, memory, filesystem, network (from Node Exporter)
Logs: Fabric log panel querying Loki
This structure allows operators to move from a product-level symptom to a platform-level cause without leaving the dashboard context. For example, elevated read latency in Fabric can be correlated with host CPU saturation or memory pressure in the same view.
The dashboard JSON and setup instructions are available in the K2view Academy:
Monitoring Dashboard Example
Monitoring Dashboard Example Setup
8. What This Stack Achieves
The VM / bare-metal monitoring stack provides visibility into:
Fabric runtime health and application behavior — from the JMX Exporter
JVM condition — memory, GC, threads, heap — from the JMX Exporter
Host-level resource usage — CPU, memory, disk, network — from Node Exporter
Fabric log output — from Promtail and Loki
All four data types are presented together in Grafana. This supports the key operational questions: Is Fabric up? Is the JVM under pressure? Is the host overloaded? What did the application log when a problem occurred?
Appendix A: Key Ports
7170 — Fabric JMX Exporter (/metrics)
7270 — iid_finder JMX Exporter (/metrics)
9100 — Node Exporter (/metrics)
9080 — Promtail HTTP server
3100 — Loki push endpoint and query API
9090 — Prometheus
3000 — Grafana
Appendix B: Key Files
$K2_HOME/monitor/jmx_exporter/jmx_prometheus_javaagent-1.5.0.jar — JMX Exporter JAR
$K2_HOME/monitor/jmx_exporter/fabric_config.yaml — Fabric exporter config
$K2_HOME/monitor/jmx_exporter/iidfinder_config.yaml — iid_finder exporter config
$K2_HOME/monitor/jmx_exporter/fabric_7_monitor.sh — configures jvm.options and enables JMX
$K2_HOME/monitor/node_exporter/node_exporter — Node Exporter binary
$K2_HOME/monitor/promtail/promtail_config.sh — configures and starts Promtail
$K2_HOME/monitor/promtail/promtail-fabric-config.yaml — Promtail config template
$K2_HOME/config/jvm.options — Fabric JVM options (javaagent line is appended here)
Appendix C: Validation Checks
Fabric metrics endpoint:
curl http://localhost:7170/metrics
iid_finder metrics endpoint:
curl http://localhost:7270/metrics
Node Exporter metrics endpoint:
curl http://localhost:9100/metrics
Prometheus targets (from monitoring machine):
curl http://<MONITORING_MACHINE>:9090/api/v1/targets
Appendix D: Environment Variables
MONITORING — Controls whether the monitoring stack is initialized. Set to 'default' or 'true' to enable. Set to 'NONE' to suppress. If unset, monitoring is not started.
LOKI_HOST — The hostname or IP address of the Loki server. Promtail only starts if this variable is set.
Security note: The fabric_config.yaml file contains default JMX credentials (username and password). Review and update these for production deployments.
