


Report Designer
Overview
The report creation is performed using the Designer component, which is embedded into the Fabric Studio. The report creation process comprises of the following steps:
- Define a data source and input parameter(s) in an empty report canvas.
- Create the data set(s) under the data source and validate them.
- Create the report layout and bind the report elements to the data set's fields.
- Design the report's layout: fonts, colors, borders, etc.
This article describes how to initiate a new report creation and the following articles in this user guide explain about the additional steps.
New Report
To initiate a new report creation, go to the Logical Unit in the project tree, right-click on Reports > New Report and populate the report name. Click Enter to create and open an empty report canvas. The report is created with a continuous page layout, where a data region (such as a table) grows until there is no more space on the current page, leading to the generation of a following page.
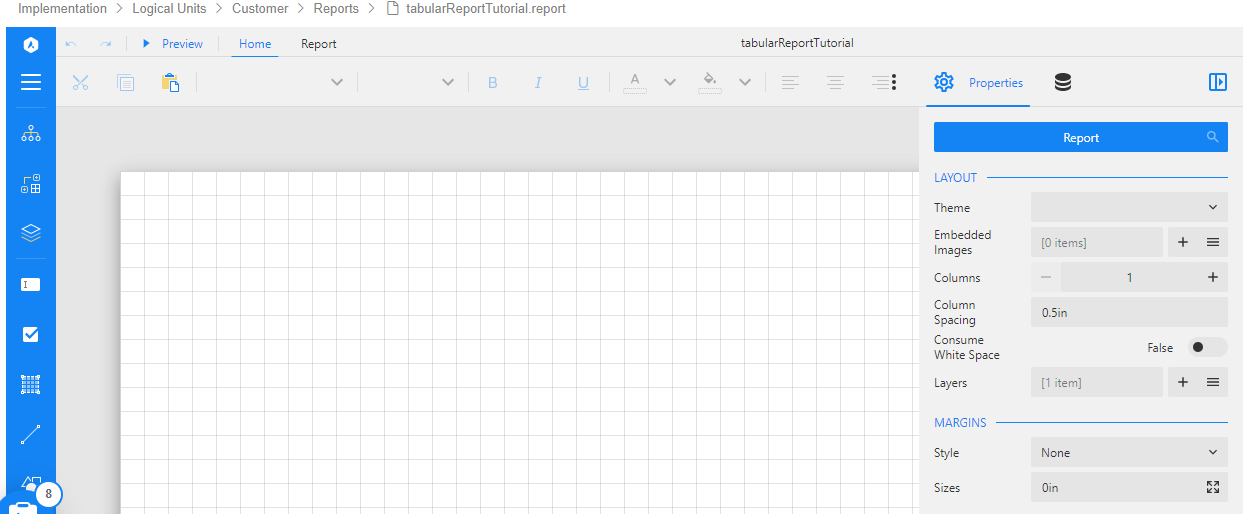
Now, click anywhere on the gray area surrounding the report in order to load the report's properties in the Properties Panel. Here you can set various report level properties, such as layout.
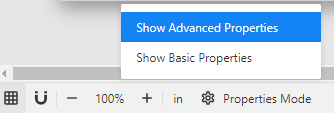
The Advanced properties can be revealed via the 3 dots icon located in the Properties Panel:


Report Designer
Overview
The report creation is performed using the Designer component, which is embedded into the Fabric Studio. The report creation process comprises of the following steps:
- Define a data source and input parameter(s) in an empty report canvas.
- Create the data set(s) under the data source and validate them.
- Create the report layout and bind the report elements to the data set's fields.
- Design the report's layout: fonts, colors, borders, etc.
This article describes how to initiate a new report creation and the following articles in this user guide explain about the additional steps.
New Report
To initiate a new report creation, go to the Logical Unit in the project tree, right-click on Reports > New Report and populate the report name. Click Enter to create and open an empty report canvas. The report is created with a continuous page layout, where a data region (such as a table) grows until there is no more space on the current page, leading to the generation of a following page.
Now, click anywhere on the gray area surrounding the report in order to load the report's properties in the Properties Panel. Here you can set various report level properties, such as layout.
The Advanced properties can be revealed via the 3 dots icon located in the Properties Panel:
