


Discovery Execution Monitor
The Discovery Execution Monitor tracks the progress of the Discovery process, providing valuable insights to follow up on job execution by displaying progress for each step.
Click Discovery in the top Catalog navigation bar to open the monitor:

The monitor includes the following areas:
The data platform selection drop-down, along with Run and Stop icons, is located at the top of the monitor screen:

- The monitor enables starting the discovery for the selected data platform. Once the discovery start, the spinner is displayed, indicating the progress.
- Discovery can be terminated when it is in progress, if needed.
- The monitor shows the last execution for the selected data platform, either during its progress or when completed.
Three progress bars, each one representing a part of the discovery process:
- Crawler over data platform, displaying the crawler progress.
- Plugin execution pipeline, displaying the aggregated progress of all active plugins.
- Version creation in Graph DB, displaying the progress of writing into the Neo4j.
The General Info area shows the job's start time, duration, execution status and version. If the job is completed, the end time is displayed as well.
The monitor's main area shows the progress of each step, including the completion percentage and the number of elements found.
- Steps displayed in this area are dynamic and depend on job configuration. Disabled plugins are not displayed.
- Each step has an indication whether it is in progress, not started, completed or failed.
- Upon completion of the job, the monitor displays the version number and indicates whether a new version has been created or not.
The execution progress is displayed by using various icons, as follows:
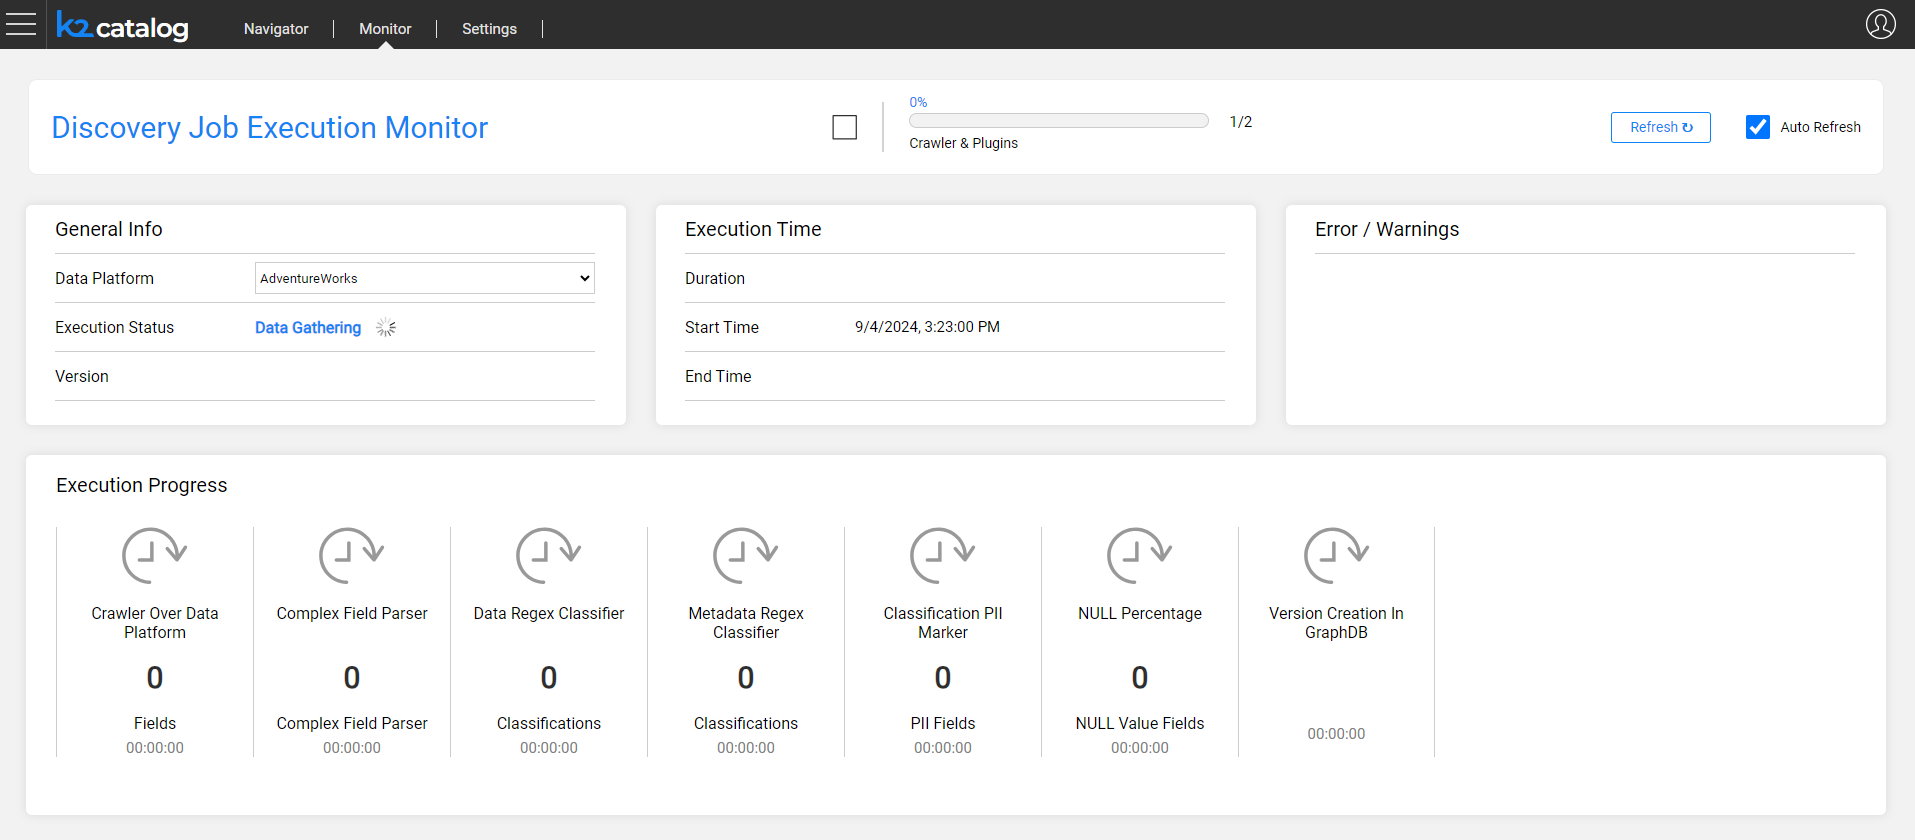
The following image shows that the job is gathering the source data in order to start the crawler:
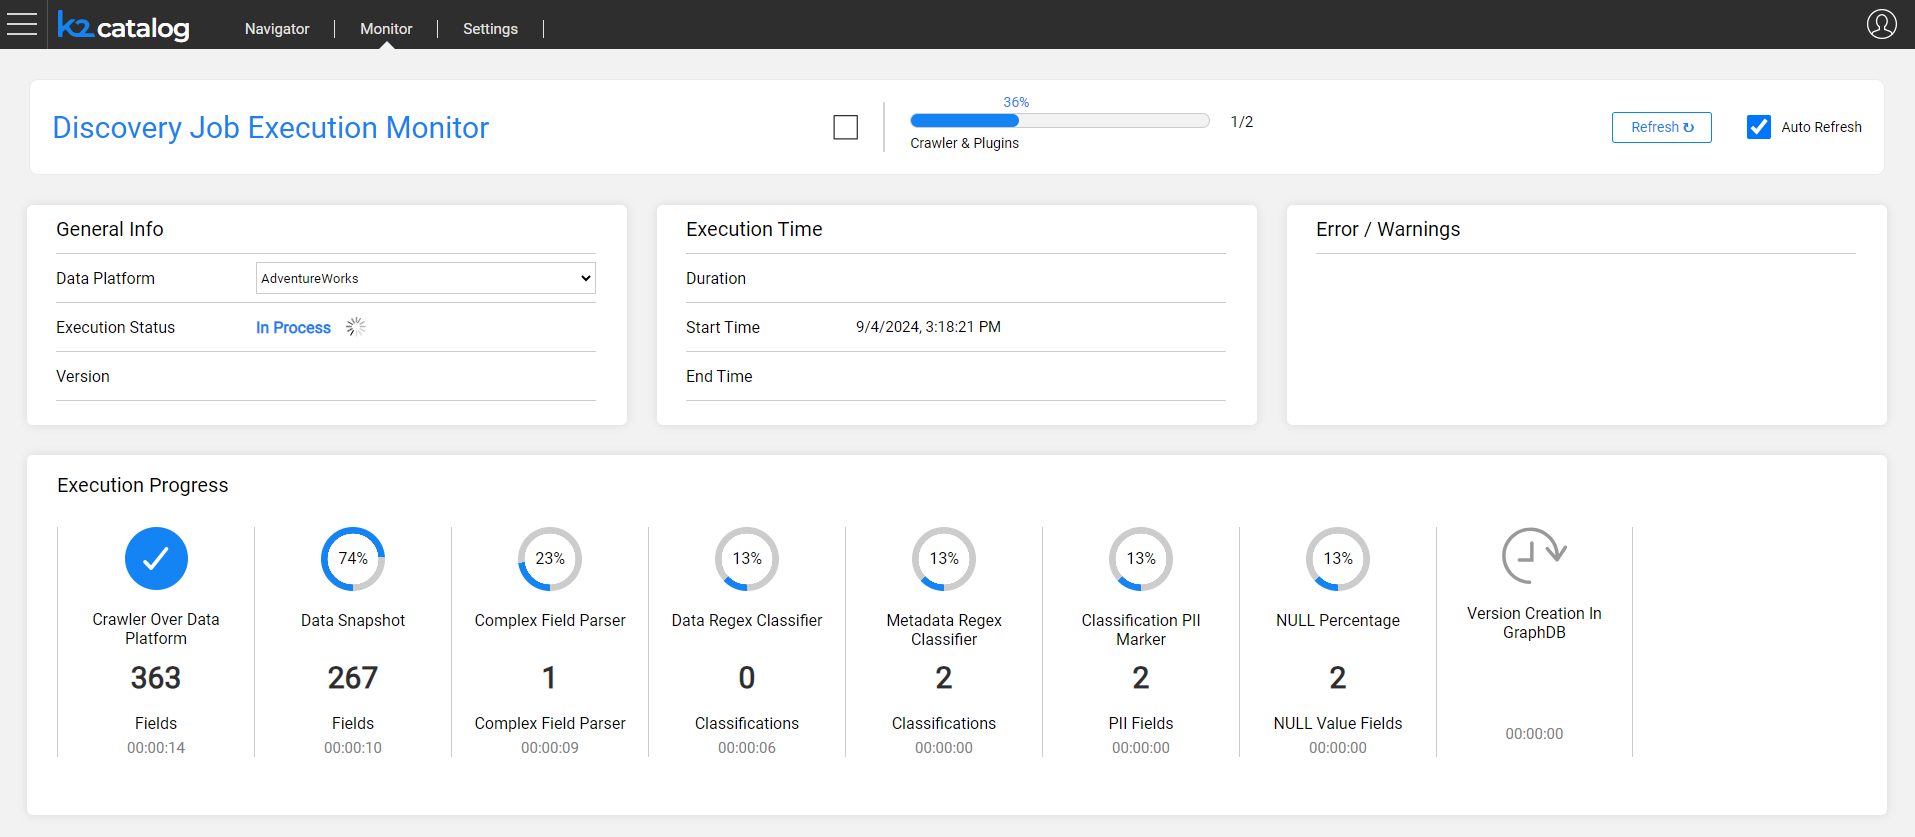
The following image shows that the job is currently running, while some plugins have warnings or errors. The error message as well as the number of warnings are show in the expanded More Info area, which can be collapsed, if needed.
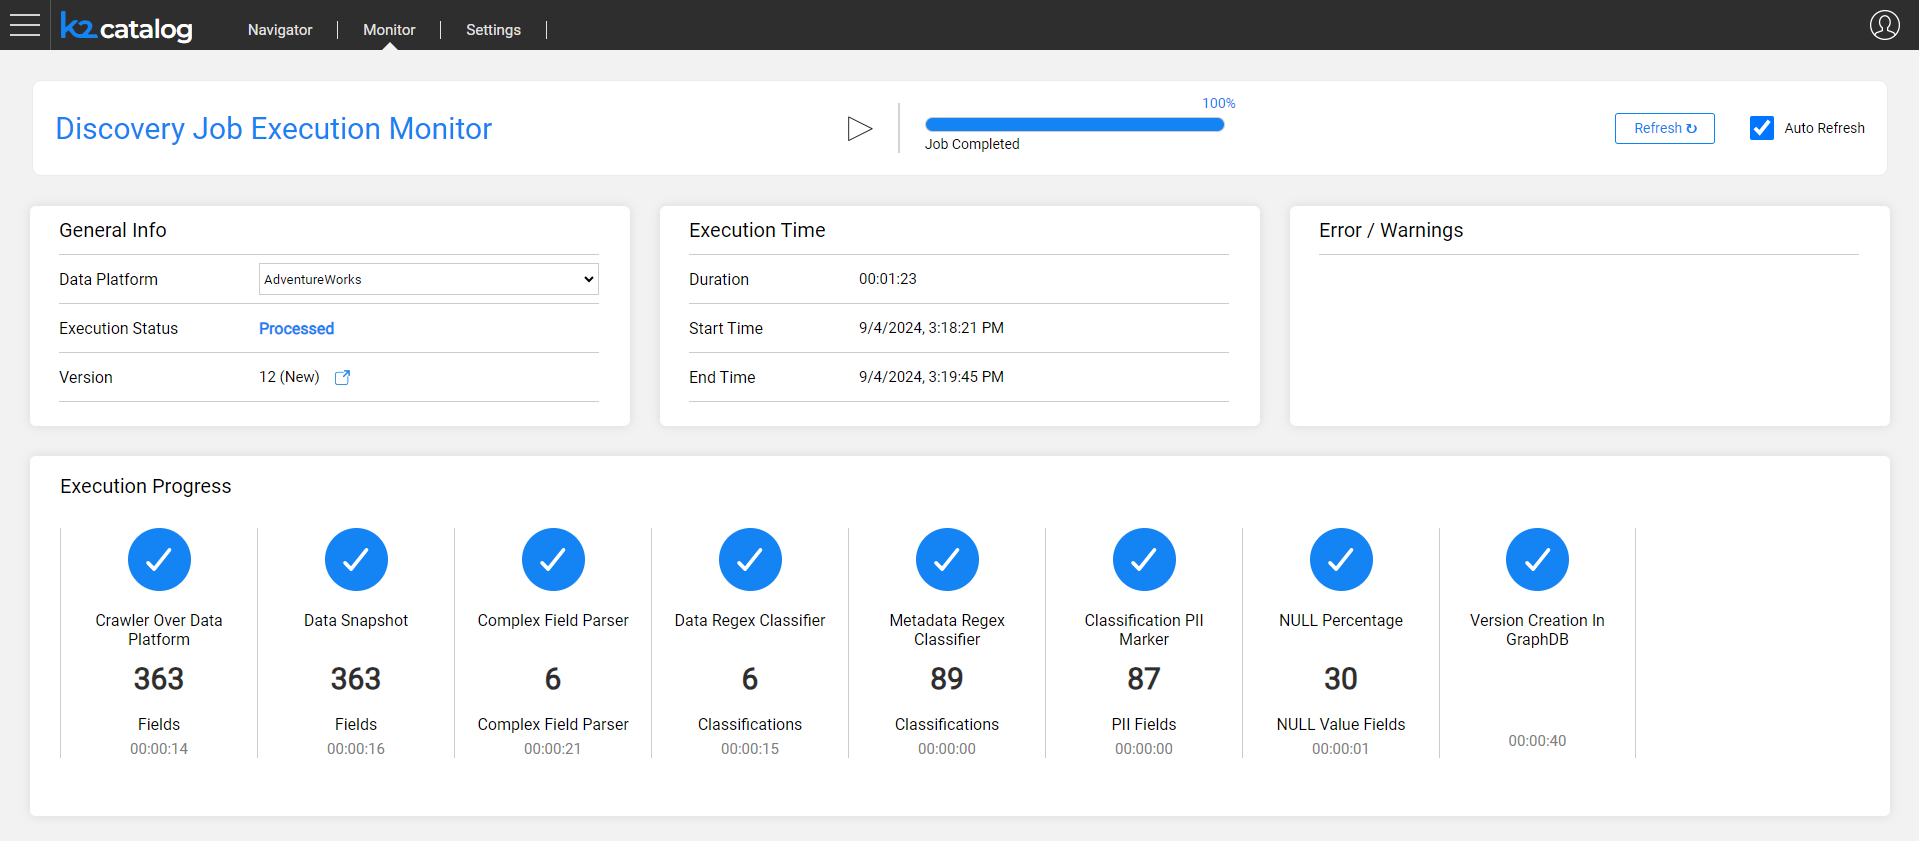
The following image shows that the job has been completed and a new version was created:
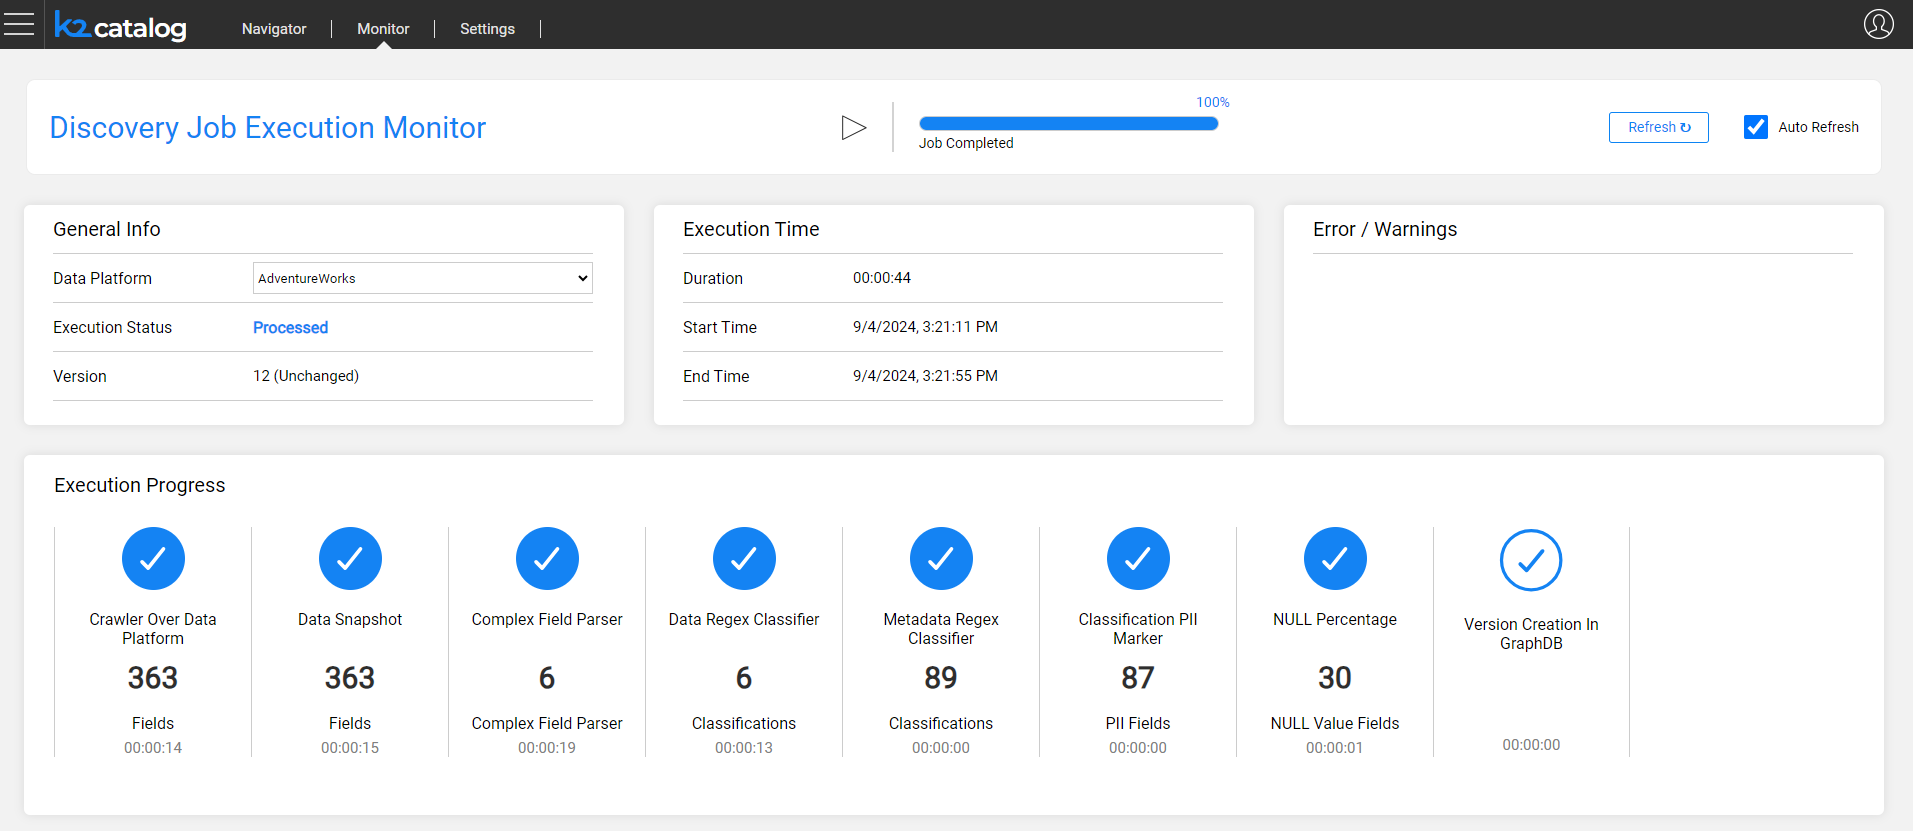
The following image shows that the job has been completed without creating a new version, since no changes were detected from the previous version:


Discovery Execution Monitor
The Discovery Execution Monitor tracks the progress of the Discovery process, providing valuable insights to follow up on job execution by displaying progress for each step.
Click Discovery in the top Catalog navigation bar to open the monitor:
The monitor includes the following areas:
The data platform selection drop-down, along with Run and Stop icons, is located at the top of the monitor screen:
- The monitor enables starting the discovery for the selected data platform. Once the discovery start, the spinner is displayed, indicating the progress.
- Discovery can be terminated when it is in progress, if needed.
- The monitor shows the last execution for the selected data platform, either during its progress or when completed.
Three progress bars, each one representing a part of the discovery process:
- Crawler over data platform, displaying the crawler progress.
- Plugin execution pipeline, displaying the aggregated progress of all active plugins.
- Version creation in Graph DB, displaying the progress of writing into the Neo4j.
The General Info area shows the job's start time, duration, execution status and version. If the job is completed, the end time is displayed as well.
The monitor's main area shows the progress of each step, including the completion percentage and the number of elements found.
- Steps displayed in this area are dynamic and depend on job configuration. Disabled plugins are not displayed.
- Each step has an indication whether it is in progress, not started, completed or failed.
- Upon completion of the job, the monitor displays the version number and indicates whether a new version has been created or not.
The execution progress is displayed by using various icons, as follows:
The following image shows that the job is gathering the source data in order to start the crawler:
The following image shows that the job is currently running, while some plugins have warnings or errors. The error message as well as the number of warnings are show in the expanded More Info area, which can be collapsed, if needed.
The following image shows that the job has been completed and a new version was created:
The following image shows that the job has been completed without creating a new version, since no changes were detected from the previous version:
