


Task Execution — Monitor
The Execution Summary & Monitor window displays real-time progress and statistics for a task execution. The window title includes the execution ID (e.g., Exec ID 294 - Execution Summary & Monitor).
The monitor window can be opened in two ways:
- Automatically when a task is executed from the TDM Portal.
- From the Execution Dashboard by clicking an execution record.
Header Information
The header section displays key details about the execution:
- Task name and Task type (e.g., Extract & Load, Extract & Delete & Load)
- Task start time and Task end time (populated when the execution ends)
- Business entity — populated for entity-based tasks; empty for table-based tasks
- Source env and Target env
- Executed by — the user who triggered the execution
- Version exp date — the expiration date of the data version, if applicable
- Execution note — a free-text note added at execution time, if populated
Progress Indicators
The progress indicators in the top-right of the header differ by data type:
Entity-based tasks display three circles representing each execution phase:
- Pre Execution — progress of pre-execution processes
- Logical Units — progress of LU processing
- Post Execution — progress of post-execution processes
Each circle shows a completion percentage while running, and a checkmark when complete. The circle color reflects the final status (green for success, purple for post execution complete, red for failure).
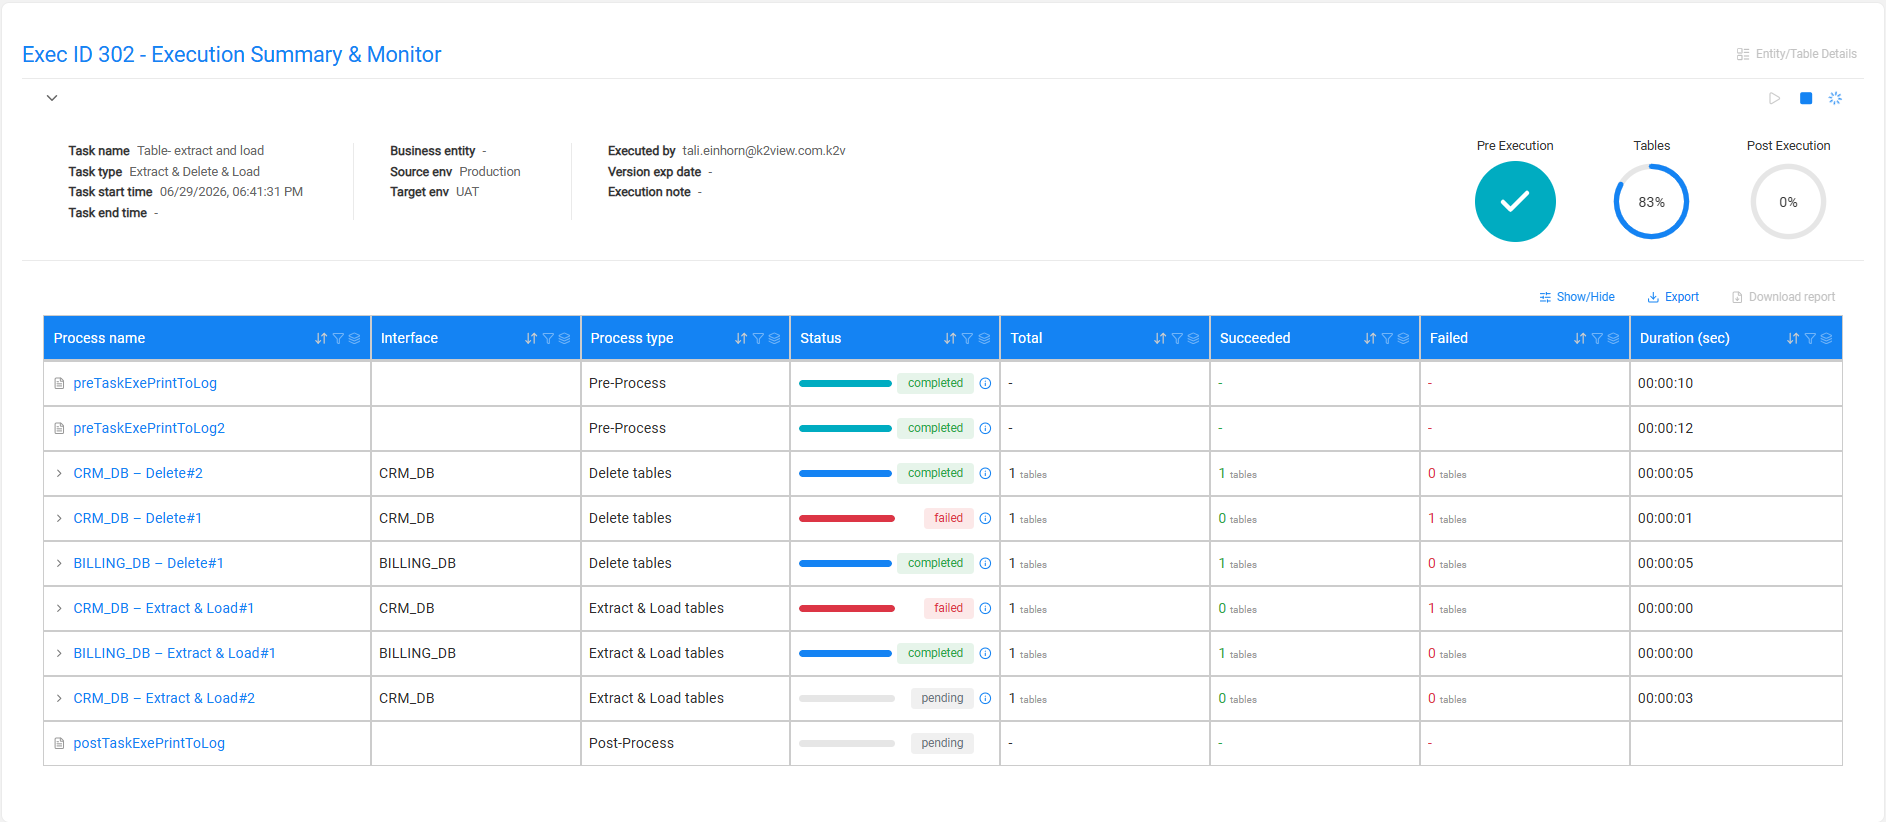
Table-based tasks display a single Tables circle showing the overall progress of table processing.
Execution Monitor Table
Every batch process in the execution is listed as a separate row in the monitor table. The table supports sorting and filtering on each column.
Entity-based Tasks
| Column | Description | |---|---| | Process name | The name of the process (LU name, pre- or post-execution process name). Clickable — opens detailed statistics. | | Process type | LU, Pre-Process, or Post-Process | | Status | A progress bar and status label: pending, running, completed, or failed | | Total | Total number of entities processed | | Succeeded | Number of successfully processed entities | | Failed | Number of failed entities | | Duration (sec) | Execution duration in HH:MM:SS format |
Rows appear in execution order: pre-execution processes first, then LUs in hierarchy order, then post-execution processes. Pre- and post-execution process rows do not show entity counts (displayed as -).
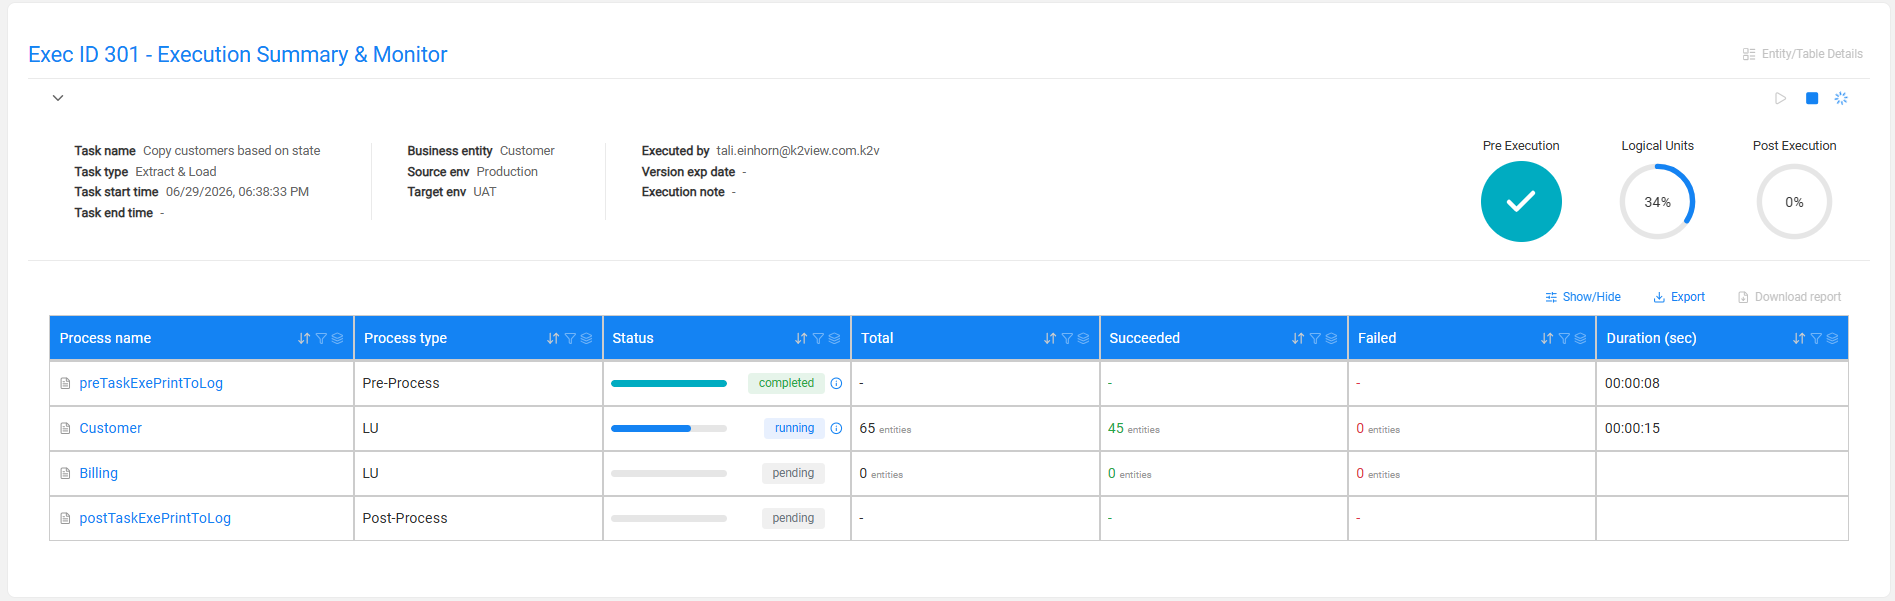
Table-based Tasks
Table-based tasks follow the same structure but include an additional Interface column (between Process name and Process type) identifying the database interface for each batch process. Pre- and post-execution processes, if added to the task, are also listed as separate rows.
Process types for table-level rows are Delete tables, Extract & Load tables, Extract tables, or Load tables, depending on the task actions.
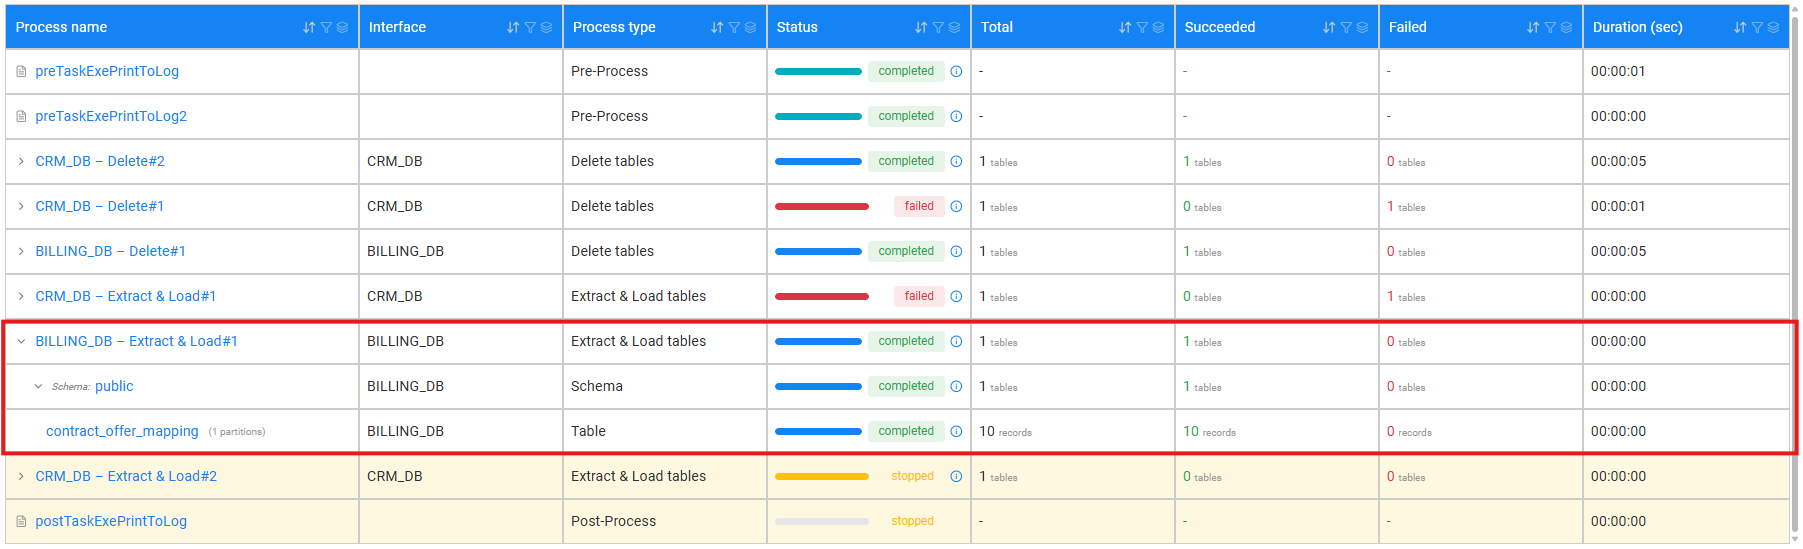
Each table-level process row can be expanded to view its internal breakdown:
- Schema level — the schema processed within the interface
- Table level — the individual table name, number of partitions (if applicable), and record counts (Total, Succeeded, Failed)
The process table in the window can be grouped by interface using the Toggle grouping button, which reorganizes rows into interface-level groups (e.g., Interface: CRM_DB (4), Interface: BILLING_DB (2)).
Actions
The following actions are available from the monitor window:
- Stop (■ icon) — stops the execution of running or pending processes and sets the execution status to stopped.
- Resume (▶ icon) — resumes a stopped execution.
- Settings (⚙ icon) — opens execution settings.
- Show/Hide — shows or hides columns in the monitor table.
- Export — exports the monitor table data.
- Download report — downloads the full execution report.
Open Batch Monitor
Click the ⓘ (information) icon next to a process row to open the Batch Monitor for that process, providing additional tracking details. Hovering over the icon displays an Open Batch Monitor tooltip.
Entity/Table Details — Detailed Statistics
Click Entity/Table Details in the top-right corner of the monitor window to open the Detailed statistics page. The page layout differs by data type.
Entity-based Tasks
The Detailed statistics page shows:
- Left panel — Logical Units Hierarchy: lists the task's LUs. Click an LU to filter the statistics by that LU.
- Summary cards at the top:
- Completed entities and Failed entities
- Completed tables and Failed tables
- Entity table — lists the processed entities with their Source ID and Target ID (the replaced sequence ID in the target environment). The table supports search and pagination.
Click a Source ID to open the Entity statistics popup for that entity, which shows:
- The entity identifier (LU name, Source ID, Target ID)
- Completed list and Failed list tabs
- For each instance: Source ID, Target ID, Entity status, and Hierarchy status
- For failed entities: the full error message displayed below the table
Table-based Tasks
The Detailed statistics page shows:
- Summary cards: Completed tables and Failed tables
- Table listing each processed table with:
- Table name
- Successful records — number of records successfully processed
- Failed records — number of records that failed
- Error message — error details for failed tables
Click ← Back to monitor to return to the Execution Summary & Monitor window.


Task Execution — Monitor
The Execution Summary & Monitor window displays real-time progress and statistics for a task execution. The window title includes the execution ID (e.g., Exec ID 294 - Execution Summary & Monitor).
The monitor window can be opened in two ways:
- Automatically when a task is executed from the TDM Portal.
- From the Execution Dashboard by clicking an execution record.
Header Information
The header section displays key details about the execution:
- Task name and Task type (e.g., Extract & Load, Extract & Delete & Load)
- Task start time and Task end time (populated when the execution ends)
- Business entity — populated for entity-based tasks; empty for table-based tasks
- Source env and Target env
- Executed by — the user who triggered the execution
- Version exp date — the expiration date of the data version, if applicable
- Execution note — a free-text note added at execution time, if populated
Progress Indicators
The progress indicators in the top-right of the header differ by data type:
Entity-based tasks display three circles representing each execution phase:
- Pre Execution — progress of pre-execution processes
- Logical Units — progress of LU processing
- Post Execution — progress of post-execution processes
Each circle shows a completion percentage while running, and a checkmark when complete. The circle color reflects the final status (green for success, purple for post execution complete, red for failure).
Table-based tasks display a single Tables circle showing the overall progress of table processing.
Execution Monitor Table
Every batch process in the execution is listed as a separate row in the monitor table. The table supports sorting and filtering on each column.
Entity-based Tasks
| Column | Description | |---|---| | Process name | The name of the process (LU name, pre- or post-execution process name). Clickable — opens detailed statistics. | | Process type | LU, Pre-Process, or Post-Process | | Status | A progress bar and status label: pending, running, completed, or failed | | Total | Total number of entities processed | | Succeeded | Number of successfully processed entities | | Failed | Number of failed entities | | Duration (sec) | Execution duration in HH:MM:SS format |
Rows appear in execution order: pre-execution processes first, then LUs in hierarchy order, then post-execution processes. Pre- and post-execution process rows do not show entity counts (displayed as -).
Table-based Tasks
Table-based tasks follow the same structure but include an additional Interface column (between Process name and Process type) identifying the database interface for each batch process. Pre- and post-execution processes, if added to the task, are also listed as separate rows.
Process types for table-level rows are Delete tables, Extract & Load tables, Extract tables, or Load tables, depending on the task actions.
Each table-level process row can be expanded to view its internal breakdown:
- Schema level — the schema processed within the interface
- Table level — the individual table name, number of partitions (if applicable), and record counts (Total, Succeeded, Failed)
The process table in the window can be grouped by interface using the Toggle grouping button, which reorganizes rows into interface-level groups (e.g., Interface: CRM_DB (4), Interface: BILLING_DB (2)).
Actions
The following actions are available from the monitor window:
- Stop (■ icon) — stops the execution of running or pending processes and sets the execution status to stopped.
- Resume (▶ icon) — resumes a stopped execution.
- Settings (⚙ icon) — opens execution settings.
- Show/Hide — shows or hides columns in the monitor table.
- Export — exports the monitor table data.
- Download report — downloads the full execution report.
Open Batch Monitor
Click the ⓘ (information) icon next to a process row to open the Batch Monitor for that process, providing additional tracking details. Hovering over the icon displays an Open Batch Monitor tooltip.
Entity/Table Details — Detailed Statistics
Click Entity/Table Details in the top-right corner of the monitor window to open the Detailed statistics page. The page layout differs by data type.
Entity-based Tasks
The Detailed statistics page shows:
- Left panel — Logical Units Hierarchy: lists the task's LUs. Click an LU to filter the statistics by that LU.
- Summary cards at the top:
- Completed entities and Failed entities
- Completed tables and Failed tables
- Entity table — lists the processed entities with their Source ID and Target ID (the replaced sequence ID in the target environment). The table supports search and pagination.
Click a Source ID to open the Entity statistics popup for that entity, which shows:
- The entity identifier (LU name, Source ID, Target ID)
- Completed list and Failed list tabs
- For each instance: Source ID, Target ID, Entity status, and Hierarchy status
- For failed entities: the full error message displayed below the table
Table-based Tasks
The Detailed statistics page shows:
- Summary cards: Completed tables and Failed tables
- Table listing each processed table with:
- Table name
- Successful records — number of records successfully processed
- Failed records — number of records that failed
- Error message — error details for failed tables
Click ← Back to monitor to return to the Execution Summary & Monitor window.
