

Operation
3.2 Review the results
The following are the required steps to review, understand, and fix the results based on their priority:
1. Login into sonarQube UI https://\
Note: url is defined in sonar.properties file under conf folder. Check sonar.web.host and sonar.web.port under WEB SERVER section.
   Default login user/pass is admin/admin.
   Default url is https://localhost:9000
Note: You have the option to create/manage users under Administration -> Security -> Users.
(see SonarQube security information)
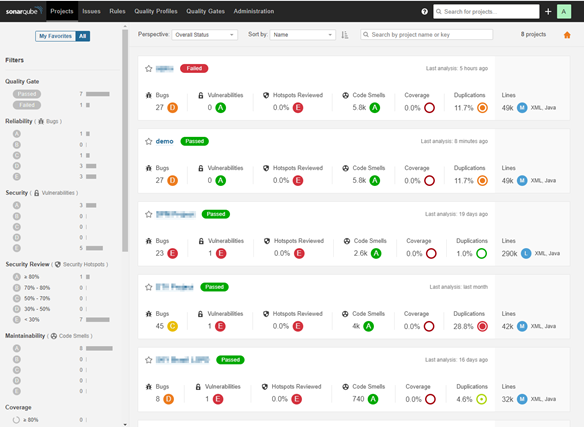
2. You will be directed to the projects you have permission to access.
3. Click on the name of your project. You will be directed to the analysis overview of the project window:
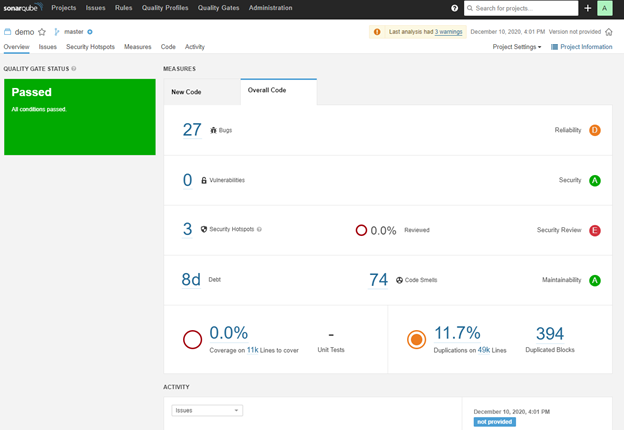
The issues are divided into three types: Bugs, Vulnerabilities, and Code Smells.
Each type has five (5) levels of severity:
  BLOCKER:    Must be fixed immediately
  CRITICAL:    To be fixed as soon as possible
  MAJOR:    To be fixed as soon as possible
  MINOR:    Not urgent.
  INFO:        Not urgent.
You can find additional information using the below links:*
https://docs.sonarqube.org/latest/user-guide/issues/
https://docs.sonarqube.org/latest/user-guide/security-hotspots/
On top of the Overall Code tab which represents the analysis results for all scans, an additional tab will be created new code scanning.
4. Click on the issues tab to see more detailed view of the identified issues.
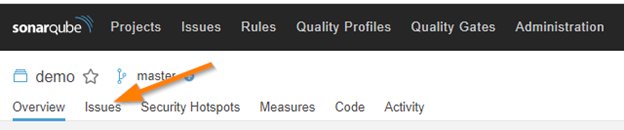
You will be directed to the issues page:
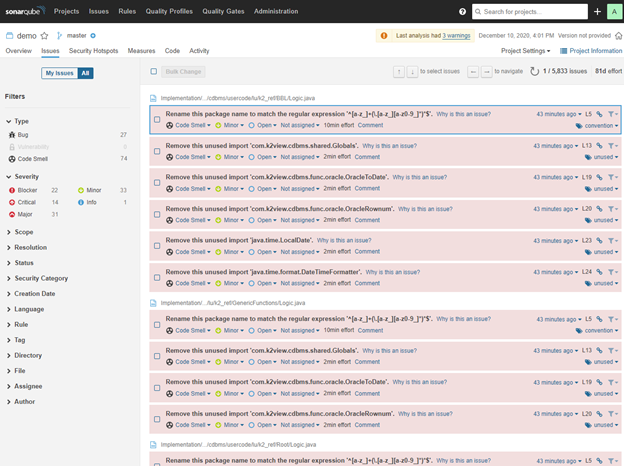
As you can see in the above screenshot, the left panel contains filters that can be used to search for specific types or specific rules.
On the right panel of the window, the exact issue, along with the severity and few additional details, will be displayed.
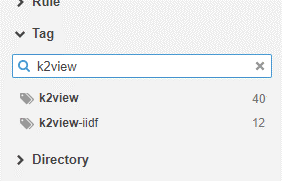
5. There are many available filters. The most common ones are listed below:
 - Type: Type of the issue.
 - Severity: Severity of the issues.
 - Rule: Search by rule name, for k2view customized rule names please refer to K2View Customized Rules.
 - Tag:    K2view customized rules are tagged with “k2view” and “k2view-iidf”
By selecting “k2view” tag, you will only see issues related to k2view code/configuration.
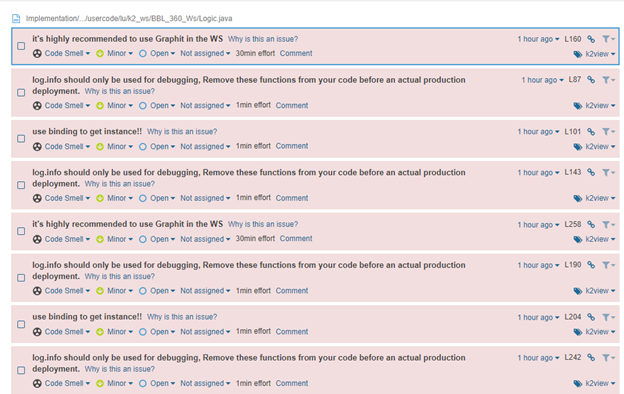
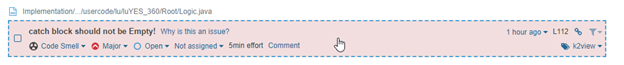
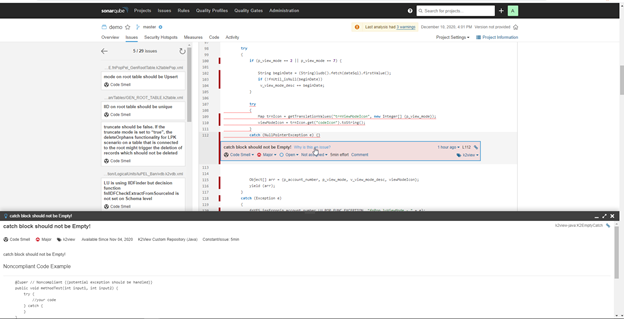
6. Navigate to see the details of the issues:
On the right panel, all the issues are being listed. Each block contains the rule name that identifies this issue, type, severity, etc…
Once you click on the block, the issue’s exact line of code will appear as shown below.
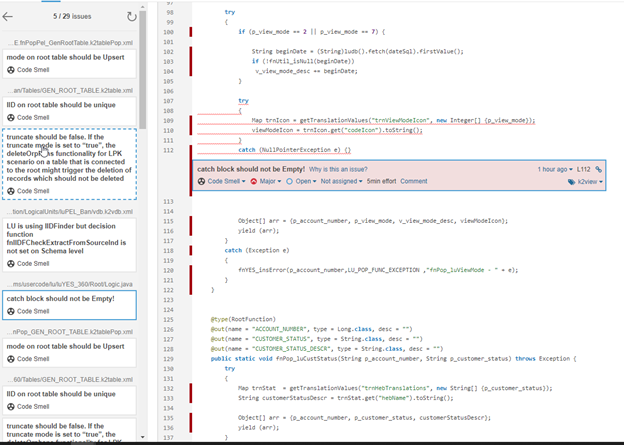
You have the option to get additional details such as:
  •    Why this is an issue
  •    Suggestion for fixing it
Once you click on “Why this is an issue?” you will get a details panel on the bottom of the screen.
For additional details on issues review and how to handle them, please refer to: SonarQube User Guide

Operation
3.2 Review the results
The following are the required steps to review, understand, and fix the results based on their priority:
1. Login into sonarQube UI https://\
Note: url is defined in sonar.properties file under conf folder. Check sonar.web.host and sonar.web.port under WEB SERVER section.
   Default login user/pass is admin/admin.
   Default url is https://localhost:9000
Note: You have the option to create/manage users under Administration -> Security -> Users.
(see SonarQube security information)
2. You will be directed to the projects you have permission to access.
3. Click on the name of your project. You will be directed to the analysis overview of the project window:
The issues are divided into three types: Bugs, Vulnerabilities, and Code Smells.
Each type has five (5) levels of severity:
  BLOCKER:    Must be fixed immediately
  CRITICAL:    To be fixed as soon as possible
  MAJOR:    To be fixed as soon as possible
  MINOR:    Not urgent.
  INFO:        Not urgent.
You can find additional information using the below links:*
https://docs.sonarqube.org/latest/user-guide/issues/
https://docs.sonarqube.org/latest/user-guide/security-hotspots/
On top of the Overall Code tab which represents the analysis results for all scans, an additional tab will be created new code scanning.
4. Click on the issues tab to see more detailed view of the identified issues.
You will be directed to the issues page:
As you can see in the above screenshot, the left panel contains filters that can be used to search for specific types or specific rules.
On the right panel of the window, the exact issue, along with the severity and few additional details, will be displayed.
5. There are many available filters. The most common ones are listed below:
 - Type: Type of the issue.
 - Severity: Severity of the issues.
 - Rule: Search by rule name, for k2view customized rule names please refer to K2View Customized Rules.
 - Tag:    K2view customized rules are tagged with “k2view” and “k2view-iidf”
By selecting “k2view” tag, you will only see issues related to k2view code/configuration.
6. Navigate to see the details of the issues:
On the right panel, all the issues are being listed. Each block contains the rule name that identifies this issue, type, severity, etc…
Once you click on the block, the issue’s exact line of code will appear as shown below.
You have the option to get additional details such as:
  •    Why this is an issue
  •    Suggestion for fixing it
Once you click on “Why this is an issue?” you will get a details panel on the bottom of the screen.
For additional details on issues review and how to handle them, please refer to: SonarQube User Guide
