


Code Debugging
One of the key features of the Fabric Web Studio is its debugging support. The built-in debugger helps accelerate your edit, compile and debug loop.
Note: This article covers code debugging. You can find here information about Broadway debugging.
Debug View
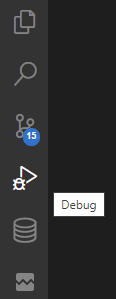
To bring up the Debug View, select the Debug icon in the Activity Bar on the side of Web Studio. You can also use the keyboard shortcut CTRL+SHIFT+D.
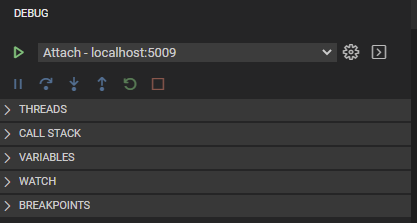
The Debug View displays all information related to running and debugging.
It consists of:
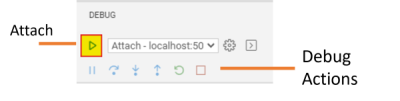
- A top bar with debugging Attach command and configuration settings.
- Debug Actions panel (Continue / Pause, Step Over, Step Into, Step Out, Restart, Stop).
- Data Inspection sections (THREADS, CALL STACK, VARIABLES, WATCH, BREAKPOINTS) which provides variety of data.
Breakpoints
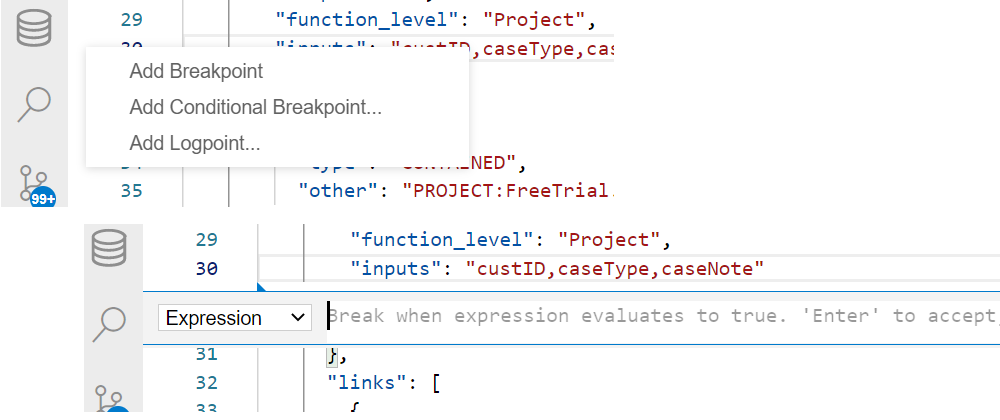
Breakpoints can be set and toggled by right-clicking in the editor margin the line on which you want to add the breakpoint and selecting "Add Breakpoint". You can optionally add a conditional breakpoint or a logpoint. An additional method for adding a breakpoint is by selecting the line on which you want to add the breakpoint, and pressing F9.
Finer breakpoint control (enable/disable/set condition) can be done in the Debug View's BREAKPOINTS section.
- Breakpoints in the editor margin are shown as red filled circles.
- Disabled breakpoints have a filled gray circle.
- When a debugging session starts, breakpoints that cannot be registered with the debugger change to a gray hollow circle. The same might happen if the source is edited while a debug session without live-edit support is running.
Logpoints
A Logpoint is a variant of a breakpoint that does not "break" into the debugger but instead logs a message to the console. Logpoints are especially useful for injecting logging while debugging production servers that cannot be paused or stopped.
A Logpoint is represented by a "diamond" shaped icon. Log messages are plain text but can include expressions to be evaluated within curly braces ('{}').
Just like regular breakpoints, Logpoints can be enabled or disabled and can also be controlled by a condition and/or hit count.
When debug is running, a Debug Console is opened at bottom panels area, where these logpoints are printed.
Start Debugging
To start debugging your project implementation, click the Attach button.
The Status Bar then changes color (orange-brown for default color themes).
Debug Actions
Once a debug session starts, the Debug toolbar becomes active.
- Continue / Pause
F5 - Step Over
F10 - Step Into
F11 - Step Out
Shift+F11 - Restart
Ctrl+Shift+F5 - Stop
Shift+F5
Data Inspection
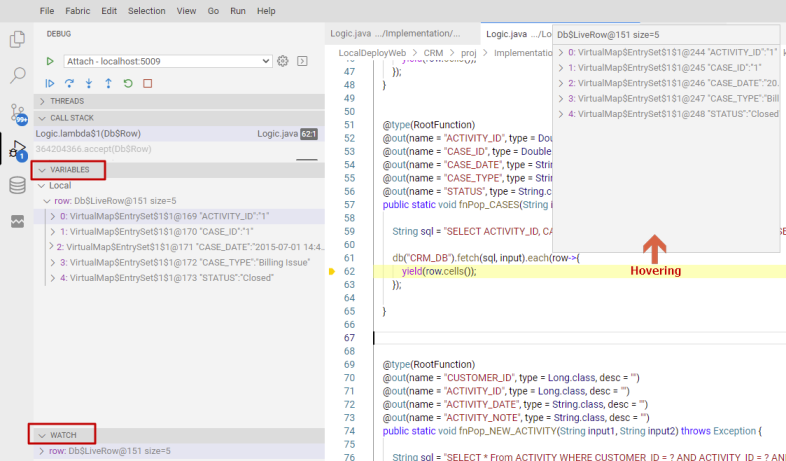
Variables can be inspected in the VARIABLES section of the Debug View or by hovering over their source in the editor. Variable values and expression evaluation are relative to the selected stack frame in the CALL STACK section.
Variable values can be modified with the Set Value action from the variable's context menu. Additionally, you can use the Copy Value action to copy the variable's value, or Copy as Expression action to copy an expression to access the variable.
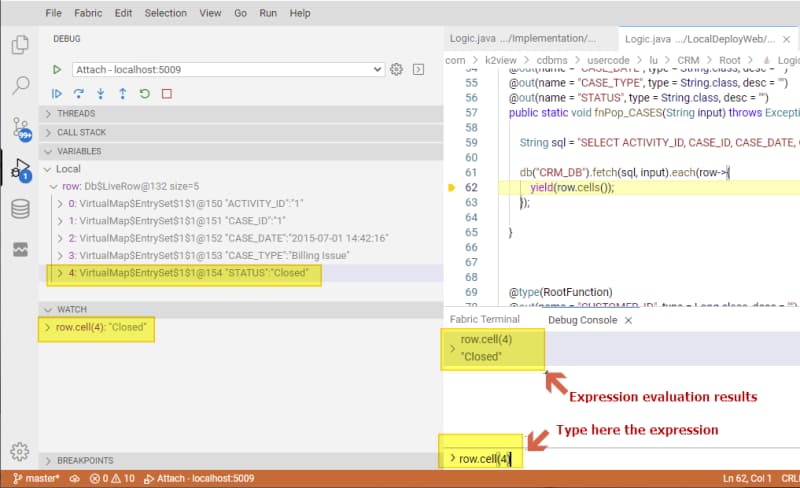
Variables and expressions can also be evaluated and watched in the Debug View's WATCH section.
Variable names and values can be filtered by typing while the focus is on the VARIABLES section
You can also evaluate expressions in the Debug Console. Below you can see various ways to inspect the same variable:
Advanced Topics
Conditional Breakpoints
A powerful debugging feature is the ability to set conditions based on expressions, hit counts, or a combination of both.
- Expression condition: The breakpoint will be hit whenever the expression evaluates to
true. A conditional breakpoint is represented by an "equal" shaped icon. - Hit count: The 'hit count' controls how many times a breakpoint needs to be hit before it will 'break' execution. Whether a 'hit count' is respected or not, and the exact syntax of the expression can vary among debugger extensions.
You can add a condition and/or hit count when creating a source breakpoint (with the Add Conditional Breakpoint action) or when modifying an existing one (with the Edit Condition action). In both cases, an inline text box with a dropdown menu opens where you can enter expressions.
Condition and hit count editing support is also supported for function and exception breakpoints. You can initiate condition editing from the context menu, or the inline Edit Condition action.
Below is an example of setting and activating an Expression Condition. The condition was set in a similar matter as setting debug execution stops at the breakpoint only when a CASE's status at "CASES" table is equal to "Open" (the used conditional expression is: row.cell(4).equals("Open")).
Run and Debug Java Applications
The Web Studio, as a developers IDE, enables you to create executable Java applications, regardless of the project or a specific LU. To run and debug such Java applications, there are several entry points for starting a debugging session: CodeLens, Context Menu, and Shortcuts.
CodeLens
You will find Run|Debug on the CodeLens of your main() function.
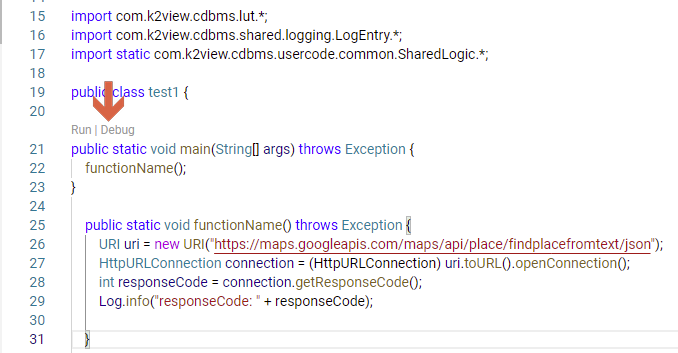
Tip: While CodeLens is disabled, you can still access the Run|Debug actions by hovering over your
main()function.
Context Menu
Another way to start debugging is to right-click a Java file in the File Explorer or editor and select Run or Debug in the context menu.
Shortcuts
Use F5 to start debugging or CTRL+F5 to start running without debugging.


Code Debugging
One of the key features of the Fabric Web Studio is its debugging support. The built-in debugger helps accelerate your edit, compile and debug loop.
Note: This article covers code debugging. You can find here information about Broadway debugging.
Debug View
To bring up the Debug View, select the Debug icon in the Activity Bar on the side of Web Studio. You can also use the keyboard shortcut CTRL+SHIFT+D.
The Debug View displays all information related to running and debugging.
It consists of:
- A top bar with debugging Attach command and configuration settings.
- Debug Actions panel (Continue / Pause, Step Over, Step Into, Step Out, Restart, Stop).
- Data Inspection sections (THREADS, CALL STACK, VARIABLES, WATCH, BREAKPOINTS) which provides variety of data.
Breakpoints
Breakpoints can be set and toggled by right-clicking in the editor margin the line on which you want to add the breakpoint and selecting "Add Breakpoint". You can optionally add a conditional breakpoint or a logpoint. An additional method for adding a breakpoint is by selecting the line on which you want to add the breakpoint, and pressing F9.
Finer breakpoint control (enable/disable/set condition) can be done in the Debug View's BREAKPOINTS section.
- Breakpoints in the editor margin are shown as red filled circles.
- Disabled breakpoints have a filled gray circle.
- When a debugging session starts, breakpoints that cannot be registered with the debugger change to a gray hollow circle. The same might happen if the source is edited while a debug session without live-edit support is running.
Logpoints
A Logpoint is a variant of a breakpoint that does not "break" into the debugger but instead logs a message to the console. Logpoints are especially useful for injecting logging while debugging production servers that cannot be paused or stopped.
A Logpoint is represented by a "diamond" shaped icon. Log messages are plain text but can include expressions to be evaluated within curly braces ('{}').
Just like regular breakpoints, Logpoints can be enabled or disabled and can also be controlled by a condition and/or hit count.
When debug is running, a Debug Console is opened at bottom panels area, where these logpoints are printed.
Start Debugging
To start debugging your project implementation, click the Attach button.
The Status Bar then changes color (orange-brown for default color themes).
Debug Actions
Once a debug session starts, the Debug toolbar becomes active.
- Continue / Pause
F5 - Step Over
F10 - Step Into
F11 - Step Out
Shift+F11 - Restart
Ctrl+Shift+F5 - Stop
Shift+F5
Data Inspection
Variables can be inspected in the VARIABLES section of the Debug View or by hovering over their source in the editor. Variable values and expression evaluation are relative to the selected stack frame in the CALL STACK section.
Variable values can be modified with the Set Value action from the variable's context menu. Additionally, you can use the Copy Value action to copy the variable's value, or Copy as Expression action to copy an expression to access the variable.
Variables and expressions can also be evaluated and watched in the Debug View's WATCH section.
Variable names and values can be filtered by typing while the focus is on the VARIABLES section
You can also evaluate expressions in the Debug Console. Below you can see various ways to inspect the same variable:
Advanced Topics
Conditional Breakpoints
A powerful debugging feature is the ability to set conditions based on expressions, hit counts, or a combination of both.
- Expression condition: The breakpoint will be hit whenever the expression evaluates to
true. A conditional breakpoint is represented by an "equal" shaped icon. - Hit count: The 'hit count' controls how many times a breakpoint needs to be hit before it will 'break' execution. Whether a 'hit count' is respected or not, and the exact syntax of the expression can vary among debugger extensions.
You can add a condition and/or hit count when creating a source breakpoint (with the Add Conditional Breakpoint action) or when modifying an existing one (with the Edit Condition action). In both cases, an inline text box with a dropdown menu opens where you can enter expressions.
Condition and hit count editing support is also supported for function and exception breakpoints. You can initiate condition editing from the context menu, or the inline Edit Condition action.
Below is an example of setting and activating an Expression Condition. The condition was set in a similar matter as setting debug execution stops at the breakpoint only when a CASE's status at "CASES" table is equal to "Open" (the used conditional expression is: row.cell(4).equals("Open")).
Run and Debug Java Applications
The Web Studio, as a developers IDE, enables you to create executable Java applications, regardless of the project or a specific LU. To run and debug such Java applications, there are several entry points for starting a debugging session: CodeLens, Context Menu, and Shortcuts.
CodeLens
You will find Run|Debug on the CodeLens of your main() function.
Tip: While CodeLens is disabled, you can still access the Run|Debug actions by hovering over your
main()function.
Context Menu
Another way to start debugging is to right-click a Java file in the File Explorer or editor and select Run or Debug in the context menu.
Shortcuts
Use F5 to start debugging or CTRL+F5 to start running without debugging.
