


K2view Kubernetes Monitoring Stack for Fabric
Reference architecture for Fabric metrics and log collection, aggregation, and cross-cluster roll-up in AKS, GKE, and EKS deployments
Table of Contents
- 1. Purpose
- 2. Solution Overview
- 3. What Runs Where
- 4. Fabric Metrics Exposure
- 5. Enabling Monitoring in Kubernetes
- 6. Cluster-Local Metrics Collection — Grafana Agent
- 7. Node and Host Telemetry — node-exporter
- 8. Kubernetes State Telemetry — kube-state-metrics
- 9. Log Collection — Grafana Agent
- 10. Observability Namespace
- 11. Filtering, Relabeling, and Cardinality Control
- 12. Thanos Cross-Cluster Federation
- 13. Configuration Flow
- 14. What the Consumer Sees
- 15. Operational Considerations
- Appendix A: Component Roles
- Appendix B: Key Ports
- Appendix C: Key Environment Variables
- Related Topics
[ K8s ] This entire document applies to Kubernetes deployments on AKS (Azure), GKE (GCP), and EKS (AWS). For VM and bare-metal deployments, see K2view VM / Bare-Metal Monitoring Stack for Fabric.
1. Purpose
This document explains the K2view monitoring stack for Fabric deployed in Kubernetes. It describes how Fabric metrics are exposed from inside the Fabric runtime, how cluster-local observability components collect metrics and logs, how Thanos extends the model across clusters, and how the resulting telemetry can be consumed by Prometheus-native and third-party monitoring platforms.
This document is Kubernetes-specific. It complements the VM / bare-metal monitoring document by focusing on the Kubernetes deployment model, where Fabric runs in pods, cluster-local collectors are deployed as Kubernetes workloads, and observability is organized around namespaces, service discovery, and space profile automation.
2. Solution Overview
The Kubernetes monitoring model is built in three layers.
At the Fabric layer, each Fabric pod exposes runtime and product telemetry through JMX MBeans. K2view packages the Prometheus JMX Exporter as a Java agent inside the Fabric runtime. The exporter reads the local MBeans and serves them through a Prometheus-format HTTP endpoint at port 7170. A separate iid_finder process exposes metrics at port 7270.
At the cluster observability layer, Grafana Agent runs in a dedicated observability namespace and scrapes Fabric pods, node-exporter instances on worker nodes, and kube-state-metrics. Grafana Agent also collects pod logs and forwards them to Loki. Scraped metrics are remote-written to a per-cluster Prometheus instance.
At the aggregation layer, each per-cluster Prometheus instance has a Thanos sidecar. A central Thanos Query layer federates across all per-cluster Prometheus instances, providing a unified cross-cluster view across AKS, GKE, and EKS deployments.
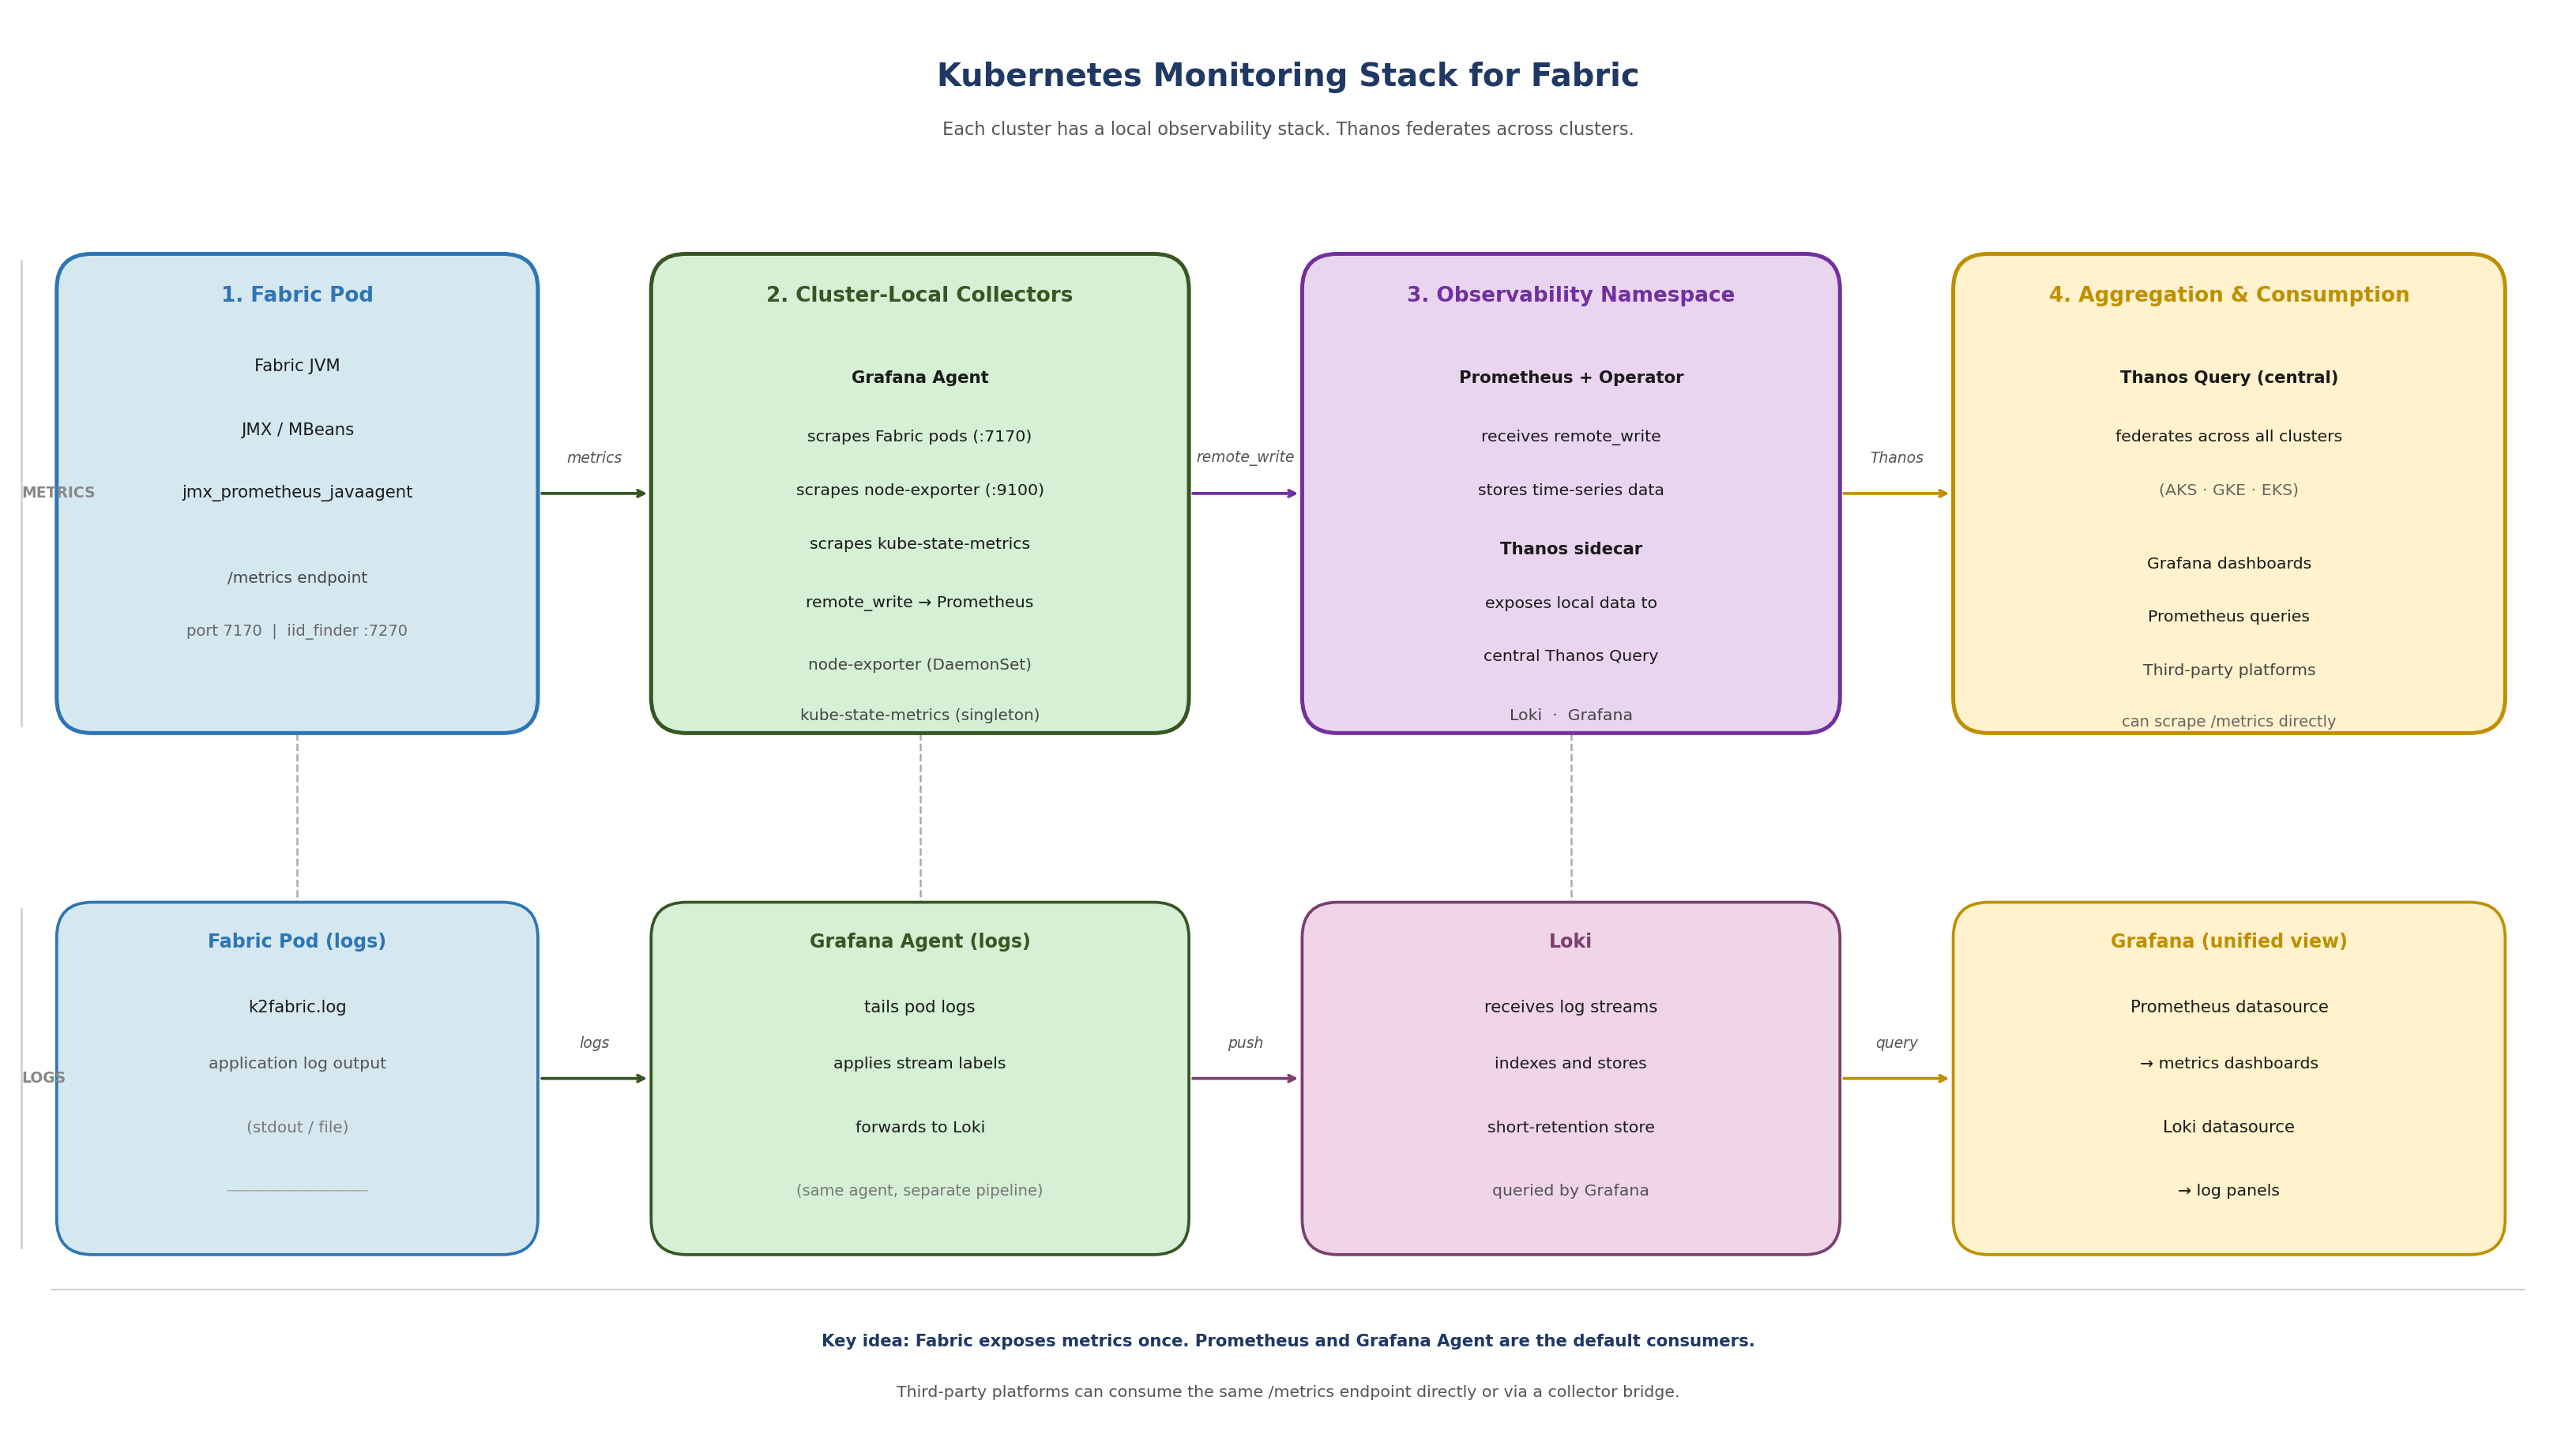
[Figure 1 — Kubernetes Monitoring Stack for Fabric]
Figure 1. Kubernetes monitoring stack for Fabric: Grafana Agent collects metrics and logs per cluster, Prometheus stores time-series data, Thanos federates across clusters, Grafana provides unified visibility.
3. What Runs Where
A key distinction in the Kubernetes model is that not all monitoring components run inside the Fabric pod. Understanding this boundary prevents confusion when diagnosing missing metrics or misconfigured collectors.
3.1 Inside the Fabric Pod
The only monitoring component that belongs to the Fabric runtime inside the pod is the JMX Exporter Java agent. It is attached to the Fabric JVM and serves metrics at localhost:7170.
A second JMX Exporter instance is attached to the iid_finder JVM and serves metrics at localhost:7270.
Note: The monitor directory inside the Fabric image also contains node_exporter and promtail binaries. These are present due to legacy packaging from the VM-era monitoring model. In Kubernetes, these binaries are not started inside the container. Node-level telemetry is collected by the DaemonSet node-exporter running on the worker node, not by any process inside the Fabric pod.
3.2 Outside the Fabric Pod
All other observability components run outside the Fabric pod, in the cluster observability layer:
- Grafana Agent — deployed in the observability namespace, scrapes Fabric pods and other metrics sources, collects logs, and remote-writes to Prometheus
- Prometheus — deployed in the observability namespace, receives remote-write from Grafana Agent, stores time-series data, exposes data to Thanos sidecar
- Thanos sidecar — runs alongside Prometheus in the observability namespace, exposes local Prometheus data to the central Thanos Query layer
- node-exporter — deployed as a DaemonSet, one instance per worker node, collects operating-system and kernel metrics from the host
- kube-state-metrics — deployed as a cluster-level singleton, collects Kubernetes object and workload state metrics from the control plane
- Loki — receives log streams from Grafana Agent, indexes and stores them for querying
4. Fabric Metrics Exposure
Fabric metrics exposure begins with JMX. Fabric and the JVM emit runtime telemetry through MBeans. The shipped jmx_prometheus_javaagent is attached to the Fabric JVM at startup and reads those MBeans locally, converting them into Prometheus-format metrics available over HTTP.
4.1 Exporter Location
The exporter is bundled with Fabric under the monitor directory:
$K2_HOME/monitor/jmx_exporter/
   jmx_prometheus_javaagent-1.5.0.jar
   fabric_config.yaml # Fabric exporter configuration
   iidfinder_config.yaml # iid_finder exporter configuration
Once active, the endpoints are:
http://localhost:7170/metrics # Fabric JVM and application metrics
http://localhost:7270/metrics # iid_finder metrics
4.2 Exporter Configuration Philosophy
The exporter configuration (fabric_config.yaml) is intentionally minimal. Fabric exposes all available metrics by default. Most filtering is applied later in Grafana Agent or Prometheus, not in the exporter itself. This keeps the Fabric-side configuration stable and centralizes observability policy where retention, active series count, and storage impact are visible.
5. Enabling Monitoring in Kubernetes
For K2cloud SaaS and K2cloud Self-hosted customers, monitoring is enabled through the space profile, which is managed by K2view. Recent space profiles have monitoring enabled by default. No manual editing of jvm.options is required. If you are unsure whether monitoring is enabled in your space profile, confirm with K2view. For air-gapped deployments, see Deploying Fabric Monitoring in Air-Gapped Environments.
5.1 The Enablement Chain
The full chain from space profile to active exporter is:
Space profile: monitoring enabled (managed by K2view — confirm with K2view that your profile includes this setting)
  ↓
K2cloud Orchestrator injects MONITORING=default
  into Fabric pod as a Kubernetes secret (common-env-secrets)
  ↓
docker-entrypoint.sh → init_monitoring() in cloud_common.sh
  ↓
monitor_setup.sh runs:
  setup_monitor() — copies monitor/ dir to $FABRIC_HOME
  init_monitor() — calls fabric_7_monitor.sh
  start_monitor() — starts background processes (see note below)
  ↓
fabric_7_monitor.sh:
  appends javaagent line to jvm.options (idempotent check)
  enables JMX remote management settings
  ↓
Fabric JVM starts with exporter active at localhost:7170
Note: start_monitor() attempts to start node_exporter and promtail as background processes. In Kubernetes, node-level metrics are authoratively collected by the DaemonSet node-exporter on the worker node. Grafana Agent handles log collection. These background processes inside the pod are a legacy of the VM model and should not be relied on in Kubernetes deployments.
5.2 Consistency Across Spaces
Because monitoring enablement is driven by the space profile, it is consistent and repeatable across all monitored spaces. Each space with monitoring enabled receives the same JVM configuration, exposes metrics on the same port, and is discoverable by Grafana Agent using the same rules. There is no per-pod manual configuration.
To suppress monitoring for a specific pod, set the MONITORING environment variable to NONE. When MONITORING=NONE, monitor_setup.sh runs setup but does not start any monitoring processes.
6. Cluster-Local Metrics Collection — Grafana Agent
In Kubernetes deployments, Grafana Agent is the cluster-local metrics collector. It is deployed in the observability namespace via the k8s-monitoring Helm chart and is responsible for all metric scraping within the cluster.
Grafana Agent does not store metrics locally. It scrapes metrics from configured targets and remote-writes them to the per-cluster Prometheus instance. This is different from a traditional Prometheus deployment where Prometheus both scrapes and stores.
6.1 What Grafana Agent Scrapes
- Fabric JMX Exporter — port 7170 on each Fabric pod
- iid_finder JMX Exporter — port 7270 on each Fabric pod (where running)
- node-exporter — port 9100 on each worker node (via DaemonSet)
- kube-state-metrics — cluster-level service
- Grafana Agent itself — for agent health metrics (optional)
6.2 How Fabric Endpoints Are Discovered
Grafana Agent uses Kubernetes service discovery. It does not use static target lists. There are two supported approaches for discovering Fabric pods:
- Annotation-based autodiscovery — Fabric pods annotated with k8s.grafana.com/scrape: "true" and k8s.grafana.com/metrics.portNumber: "7170" are automatically discovered and scraped. This is disabled by default in the chart and must be explicitly enabled.
- Explicit River pipeline — a custom discovery.relabel and prometheus.scrape component configuration targets Fabric pods by label selector and port number. This gives more control over discovery rules, filtering, and label transformations.
For configuration details, see How to Configure the Collection Layer to Scrape Fabric Metrics.
6.3 Remote Write to Prometheus
After scraping, Grafana Agent remote-writes all collected metrics to the per-cluster Prometheus instance. The Prometheus endpoint is configured in the Grafana Agent values file:
externalServices:
   prometheus:
     host: <PROMETHEUS_URL>
     basicAuth:
         username: <PROMETHEUS_USER>
         password: <GRAFANA_TOKEN>
Note: In the Azure AKS blueprint, these values are placeholder tokens that must be replaced with the actual Prometheus endpoint credentials before deployment.
7. Node and Host Telemetry — node-exporter
node-exporter collects operating-system and kernel metrics from each Kubernetes worker node. It runs as a DaemonSet, which means one instance is automatically scheduled on each worker node. As nodes are added to the cluster, Kubernetes deploys a new node-exporter instance there automatically — observability coverage expands with the cluster without manual intervention.
node-exporter is not part of the Fabric pod. It is a separate cluster observability component that runs on the worker node itself, providing host-level signals:
- CPU utilization and saturation
- Memory usage and pressure
- Filesystem consumption and availability
- Disk I/O
- Network throughput and errors
- Operating system and kernel counters
These signals allow operators to distinguish between a Fabric-level problem and a node-level resource constraint — a distinction that is not possible from JVM metrics alone.
Important: node-exporter exposes a very large number of metric families by default. Without filtering, it is one of the most common sources of excessive metric volume. Apply metric_relabel_configs or River pipeline filtering rules to retain only the families that support operational monitoring. See How to Control Metric Volume with Filtering and Relabeling.
8. Kubernetes State Telemetry — kube-state-metrics
kube-state-metrics provides visibility into what Kubernetes knows about objects and workloads in the cluster. Unlike node-exporter, it does not read host operating system metrics — it reflects Kubernetes control plane state.
kube-state-metrics runs as a cluster-level singleton. It does not need to run once per node because it talks to the Kubernetes API server, not to individual nodes. One instance provides cluster-wide object state visibility.
Key signals from kube-state-metrics:
- Pod readiness and phase state
- Pod restart counts
- Deployment convergence and replica status
- Node readiness and conditions
- Drift between desired and actual state
This is the layer that explains why an apparently healthy Fabric JVM may still be part of an unhealthy service from Kubernetes' perspective — for example, a pod in a restart loop or a deployment that has not converged.
Note: kube-state-metrics label and annotation metrics can have very high cardinality in clusters where pods carry many labels. Review and filter these families carefully. See How to Control Metric Volume with Filtering and Relabeling.
9. Log Collection — Grafana Agent
In Kubernetes deployments, Grafana Agent handles log collection alongside metrics. It is not a separate promtail deployment. Grafana Agent tails pod logs from the cluster and forwards them to Loki.
The Loki endpoint is configured in the Grafana Agent values file alongside the Prometheus endpoint:
externalServices:
   loki:
      host: <LOKI_URL>
      basicAuth:
         username: <LOKI_USER>
         password: <GRAFANA_TOKEN>
This is architecturally different from the VM model, where a standalone promtail process runs on the Fabric host and is configured by promtail_config.sh. In Kubernetes, Grafana Agent handles both metrics and logs as a unified collector.
Logs and metrics remain separate telemetry types within Grafana Agent — they are collected and forwarded through different pipelines to different backends. But from an operational perspective, both are managed through the same Helm chart and values configuration.
10. Observability Namespace
Each monitored Kubernetes cluster has a dedicated observability namespace. This namespace is the local home for all monitoring infrastructure. Workload namespaces contain the Fabric pods and other application components. The observability namespace contains the systems that discover, collect, store, and forward telemetry from those workloads.
The observability namespace typically contains:
- Grafana Agent — metrics scraping and log collection
- Prometheus — time-series storage, receives remote-write from Grafana Agent
- Thanos sidecar — exposes local Prometheus data to central Thanos Query
- Loki — log storage and query backend (may be central or per-cluster)
This bundle is deployed per monitored cluster. When a new cluster is added, the same observability namespace pattern is deployed into it and enrolled in the Thanos federation. Observability coverage is repeatable and consistent across clusters.
Note: The observability namespace described here reflects the K2view monitoring model. In practice, the exact namespace name and component layout may vary by deployment. The important principle is the separation between workload namespaces and the monitoring control plane.
11. Filtering, Relabeling, and Cardinality Control
Grafana Agent applies filtering and relabeling to scraped metrics before remote-writing to Prometheus. This is the primary mechanism for controlling metric volume, active series count, and storage growth.
The K2view model keeps the Fabric exporter configuration minimal and applies observability policy in the collection layer — in this case, in the Grafana Agent River pipeline. This centralizes scale control where storage consequences are visible.
Key principles:
- Filter by metric family: keep only the families used in dashboards and alerts (fabric_, jvm_, tomcat_*, node CPU/memory/disk families, key kube-state-metrics families)
- Reduce label cardinality: drop labels that are not used in aggregations or alert conditions
- Monitor active series: prometheus_tsdb_head_series is the primary Prometheus health signal — it reflects true storage and query footprint
- Review retention: effective retention depends on both the configured time window and storage capacity — filter aggressively enough that the time window is not cut short by storage pressure
For detailed guidance and River pipeline syntax, see How to Control Metric Volume with Filtering and Relabeling.
12. Thanos Cross-Cluster Federation
Each monitored cluster has a local Prometheus instance with a Thanos sidecar. A central Thanos Query layer federates across all per-cluster Prometheus instances, providing a unified view across AKS (Azure), GKE (GCP), and EKS (AWS) deployments.
The model preserves local collection:
- Grafana Agent scrapes within the cluster
- Prometheus stores and indexes locally
- Thanos sidecar exposes the local store to the central query layer
- Thanos Query federates without duplicating or centralizing ingestion
This means local observability — cluster-local dashboards, per-cluster troubleshooting, per-cluster alert rules — remains fully functional without a dependency on the central Thanos layer. Thanos provides the additional cross-cluster view above that.
Operationally, new clusters are added by deploying the same local observability stack and Thanos sidecar pattern into the new cluster. No changes to the central Thanos Query layer are required beyond enrolling the new sidecar.
Note: The Terraform blueprints (AKS, GKE, EKS) deploy Grafana Agent as the local scraper. The Thanos layer sits above what the blueprints configure and is managed separately as part of the central observability infrastructure.
13. Configuration Flow
The following sequence describes the setup for each monitored Kubernetes cluster.
13.1 Per Cluster — Observability Stack
- Deploy the Grafana Agent k8s-monitoring Helm chart into the observability namespace
- Configure the Grafana Agent values file with the Prometheus remote-write endpoint and Loki endpoint
- Configure Grafana Agent to discover and scrape Fabric pods on port 7170 (annotation-based or explicit River pipeline)
- Confirm Grafana Agent is scraping by checking pod logs
- Confirm metrics are flowing to Prometheus
- Deploy or confirm Thanos sidecar is running alongside Prometheus
- Enroll the cluster's Thanos sidecar in the central Thanos Query layer
13.2 Per Space — Fabric Monitoring
- Confirm with K2view that monitoring is enabled in your space profile
- Confirm MONITORING=default is present in the Fabric pod environment
- Confirm fabric_7_monitor.sh has run and the javaagent line is present in jvm.options
- Validate the Fabric metrics endpoint from inside the pod:
kubectl exec -it <fabric-pod> -n <namespace> -- curl http://localhost:7170/metrics
- Confirm Grafana Agent is discovering and scraping the Fabric pod
14. What the Consumer Sees
A consuming Grafana environment sees the output of the full observability stack, not just the Fabric exporter in isolation:
- Fabric and JVM metrics — application health, memory, GC, threads, Fabric product counters
- Host and node metrics — CPU, memory, filesystem, network from node-exporter
- Kubernetes workload and state metrics — pod health, restarts, deployment state from kube-state-metrics
- Logs — detailed event context from Grafana Agent log collection via Loki
- Cross-cluster views — fleet-level health across AKS, GKE, and EKS via Thanos Query
In Grafana, this allows operators to move from a product-level metric anomaly to node-level resource pressure to pod state changes to the underlying log evidence — all within one operational view, without switching between tools.
The same metrics surface can also be consumed by third-party platforms. See How to Use the Shipped JMX Exporter with Third-Party Monitoring Platforms.
15. Operational Considerations
15.1 Troubleshoot Locally First
The monitoring model is local-first. If metrics are missing from a higher-level view, the first checks should be local:
- Is the JMX Exporter active? Curl localhost:7170/metrics from inside the pod
- Is MONITORING=default set in the pod? kubectl exec
-- env | grep MONITORING - Is Grafana Agent discovering the pod? Check Grafana Agent logs
- Is Grafana Agent remote-writing successfully? Check for remote-write errors in agent logs
- Is Prometheus receiving and storing the metrics? Query Prometheus directly
- Is the Thanos sidecar healthy? Check sidecar pod status in the observability namespace
15.2 Metrics and Logs Are Complementary
Metrics are optimized for alerting and trend analysis. Logs are optimized for detail and explanation. In the Kubernetes model, both are collected by Grafana Agent and surfaced in Grafana — but they should not be treated as interchangeable. Use metrics to identify anomalies; use logs to explain them.
15.3 Retention Depends on Volume Control
Prometheus retention has two limits: time and storage. Whichever is reached first determines effective retention. Without filtering, node-exporter and kube-state-metrics in particular can generate enough series to significantly reduce effective retention. Filtering is not optional.
15.4 Responsibility Boundaries
K2view defines the metrics surface and the architecture. The consuming monitoring team owns dashboards, alerts, retention choices, and operationalization. For third-party platform integrations, K2view's responsibility ends at the /metrics endpoint.
Appendix A: Component Roles
Appendix B: Key Ports
- 7170 — Fabric JMX Exporter (/metrics)
- 7270 — iid_finder JMX Exporter (/metrics)
- 9100 — node-exporter (/metrics)
- 9090 — Prometheus
- 3100 — Loki
Appendix C: Key Environment Variables
- MONITORING — Set to 'default' or 'true' to enable the monitor setup chain at container startup. Injected by K2cloud Orchestrator when monitoring is enabled in the space profile (managed by K2view). You can verify its presence in a running pod with: kubectl exec
-- env | grep MONITORING. - LOKI_HOST — Not used in Kubernetes deployments. Grafana Agent handles log forwarding; standalone Promtail is not used.
Related Topics
- K2view Observability Architecture for Fabric
- K2view VM / Bare-Metal Monitoring Stack for Fabric
- How to Enable the JMX Exporter for Fabric
- How to Verify That Fabric Is Exposing Metrics
- How to Configure the Collection Layer to Scrape Fabric Metrics
- How to Control Metric Volume with Filtering and Relabeling
- How to Use the Shipped JMX Exporter with Third-Party Monitoring Platforms
K2view Kubernetes Monitoring Stack for Fabric
Reference architecture for Fabric metrics and log collection, aggregation, and cross-cluster roll-up in AKS, GKE, and EKS deployments
Table of Contents
- 1. Purpose
- 2. Solution Overview
- 3. What Runs Where
- 4. Fabric Metrics Exposure
- 5. Enabling Monitoring in Kubernetes
- 6. Cluster-Local Metrics Collection — Grafana Agent
- 7. Node and Host Telemetry — node-exporter
- 8. Kubernetes State Telemetry — kube-state-metrics
- 9. Log Collection — Grafana Agent
- 10. Observability Namespace
- 11. Filtering, Relabeling, and Cardinality Control
- 12. Thanos Cross-Cluster Federation
- 13. Configuration Flow
- 14. What the Consumer Sees
- 15. Operational Considerations
- Appendix A: Component Roles
- Appendix B: Key Ports
- Appendix C: Key Environment Variables
- Related Topics
[ K8s ] This entire document applies to Kubernetes deployments on AKS (Azure), GKE (GCP), and EKS (AWS). For VM and bare-metal deployments, see K2view VM / Bare-Metal Monitoring Stack for Fabric.
1. Purpose
This document explains the K2view monitoring stack for Fabric deployed in Kubernetes. It describes how Fabric metrics are exposed from inside the Fabric runtime, how cluster-local observability components collect metrics and logs, how Thanos extends the model across clusters, and how the resulting telemetry can be consumed by Prometheus-native and third-party monitoring platforms.
This document is Kubernetes-specific. It complements the VM / bare-metal monitoring document by focusing on the Kubernetes deployment model, where Fabric runs in pods, cluster-local collectors are deployed as Kubernetes workloads, and observability is organized around namespaces, service discovery, and space profile automation.
2. Solution Overview
The Kubernetes monitoring model is built in three layers.
At the Fabric layer, each Fabric pod exposes runtime and product telemetry through JMX MBeans. K2view packages the Prometheus JMX Exporter as a Java agent inside the Fabric runtime. The exporter reads the local MBeans and serves them through a Prometheus-format HTTP endpoint at port 7170. A separate iid_finder process exposes metrics at port 7270.
At the cluster observability layer, Grafana Agent runs in a dedicated observability namespace and scrapes Fabric pods, node-exporter instances on worker nodes, and kube-state-metrics. Grafana Agent also collects pod logs and forwards them to Loki. Scraped metrics are remote-written to a per-cluster Prometheus instance.
At the aggregation layer, each per-cluster Prometheus instance has a Thanos sidecar. A central Thanos Query layer federates across all per-cluster Prometheus instances, providing a unified cross-cluster view across AKS, GKE, and EKS deployments.
[Figure 1 — Kubernetes Monitoring Stack for Fabric]
Figure 1. Kubernetes monitoring stack for Fabric: Grafana Agent collects metrics and logs per cluster, Prometheus stores time-series data, Thanos federates across clusters, Grafana provides unified visibility.
3. What Runs Where
A key distinction in the Kubernetes model is that not all monitoring components run inside the Fabric pod. Understanding this boundary prevents confusion when diagnosing missing metrics or misconfigured collectors.
3.1 Inside the Fabric Pod
The only monitoring component that belongs to the Fabric runtime inside the pod is the JMX Exporter Java agent. It is attached to the Fabric JVM and serves metrics at localhost:7170.
A second JMX Exporter instance is attached to the iid_finder JVM and serves metrics at localhost:7270.
Note: The monitor directory inside the Fabric image also contains node_exporter and promtail binaries. These are present due to legacy packaging from the VM-era monitoring model. In Kubernetes, these binaries are not started inside the container. Node-level telemetry is collected by the DaemonSet node-exporter running on the worker node, not by any process inside the Fabric pod.
3.2 Outside the Fabric Pod
All other observability components run outside the Fabric pod, in the cluster observability layer:
- Grafana Agent — deployed in the observability namespace, scrapes Fabric pods and other metrics sources, collects logs, and remote-writes to Prometheus
- Prometheus — deployed in the observability namespace, receives remote-write from Grafana Agent, stores time-series data, exposes data to Thanos sidecar
- Thanos sidecar — runs alongside Prometheus in the observability namespace, exposes local Prometheus data to the central Thanos Query layer
- node-exporter — deployed as a DaemonSet, one instance per worker node, collects operating-system and kernel metrics from the host
- kube-state-metrics — deployed as a cluster-level singleton, collects Kubernetes object and workload state metrics from the control plane
- Loki — receives log streams from Grafana Agent, indexes and stores them for querying
4. Fabric Metrics Exposure
Fabric metrics exposure begins with JMX. Fabric and the JVM emit runtime telemetry through MBeans. The shipped jmx_prometheus_javaagent is attached to the Fabric JVM at startup and reads those MBeans locally, converting them into Prometheus-format metrics available over HTTP.
4.1 Exporter Location
The exporter is bundled with Fabric under the monitor directory:
$K2_HOME/monitor/jmx_exporter/
   jmx_prometheus_javaagent-1.5.0.jar
   fabric_config.yaml # Fabric exporter configuration
   iidfinder_config.yaml # iid_finder exporter configuration
Once active, the endpoints are:
http://localhost:7170/metrics # Fabric JVM and application metrics
http://localhost:7270/metrics # iid_finder metrics
4.2 Exporter Configuration Philosophy
The exporter configuration (fabric_config.yaml) is intentionally minimal. Fabric exposes all available metrics by default. Most filtering is applied later in Grafana Agent or Prometheus, not in the exporter itself. This keeps the Fabric-side configuration stable and centralizes observability policy where retention, active series count, and storage impact are visible.
5. Enabling Monitoring in Kubernetes
For K2cloud SaaS and K2cloud Self-hosted customers, monitoring is enabled through the space profile, which is managed by K2view. Recent space profiles have monitoring enabled by default. No manual editing of jvm.options is required. If you are unsure whether monitoring is enabled in your space profile, confirm with K2view. For air-gapped deployments, see Deploying Fabric Monitoring in Air-Gapped Environments.
5.1 The Enablement Chain
The full chain from space profile to active exporter is:
Space profile: monitoring enabled (managed by K2view — confirm with K2view that your profile includes this setting)
  ↓
K2cloud Orchestrator injects MONITORING=default
  into Fabric pod as a Kubernetes secret (common-env-secrets)
  ↓
docker-entrypoint.sh → init_monitoring() in cloud_common.sh
  ↓
monitor_setup.sh runs:
  setup_monitor() — copies monitor/ dir to $FABRIC_HOME
  init_monitor() — calls fabric_7_monitor.sh
  start_monitor() — starts background processes (see note below)
  ↓
fabric_7_monitor.sh:
  appends javaagent line to jvm.options (idempotent check)
  enables JMX remote management settings
  ↓
Fabric JVM starts with exporter active at localhost:7170
Note: start_monitor() attempts to start node_exporter and promtail as background processes. In Kubernetes, node-level metrics are authoratively collected by the DaemonSet node-exporter on the worker node. Grafana Agent handles log collection. These background processes inside the pod are a legacy of the VM model and should not be relied on in Kubernetes deployments.
5.2 Consistency Across Spaces
Because monitoring enablement is driven by the space profile, it is consistent and repeatable across all monitored spaces. Each space with monitoring enabled receives the same JVM configuration, exposes metrics on the same port, and is discoverable by Grafana Agent using the same rules. There is no per-pod manual configuration.
To suppress monitoring for a specific pod, set the MONITORING environment variable to NONE. When MONITORING=NONE, monitor_setup.sh runs setup but does not start any monitoring processes.
6. Cluster-Local Metrics Collection — Grafana Agent
In Kubernetes deployments, Grafana Agent is the cluster-local metrics collector. It is deployed in the observability namespace via the k8s-monitoring Helm chart and is responsible for all metric scraping within the cluster.
Grafana Agent does not store metrics locally. It scrapes metrics from configured targets and remote-writes them to the per-cluster Prometheus instance. This is different from a traditional Prometheus deployment where Prometheus both scrapes and stores.
6.1 What Grafana Agent Scrapes
- Fabric JMX Exporter — port 7170 on each Fabric pod
- iid_finder JMX Exporter — port 7270 on each Fabric pod (where running)
- node-exporter — port 9100 on each worker node (via DaemonSet)
- kube-state-metrics — cluster-level service
- Grafana Agent itself — for agent health metrics (optional)
6.2 How Fabric Endpoints Are Discovered
Grafana Agent uses Kubernetes service discovery. It does not use static target lists. There are two supported approaches for discovering Fabric pods:
- Annotation-based autodiscovery — Fabric pods annotated with k8s.grafana.com/scrape: "true" and k8s.grafana.com/metrics.portNumber: "7170" are automatically discovered and scraped. This is disabled by default in the chart and must be explicitly enabled.
- Explicit River pipeline — a custom discovery.relabel and prometheus.scrape component configuration targets Fabric pods by label selector and port number. This gives more control over discovery rules, filtering, and label transformations.
For configuration details, see How to Configure the Collection Layer to Scrape Fabric Metrics.
6.3 Remote Write to Prometheus
After scraping, Grafana Agent remote-writes all collected metrics to the per-cluster Prometheus instance. The Prometheus endpoint is configured in the Grafana Agent values file:
externalServices:
   prometheus:
     host: <PROMETHEUS_URL>
     basicAuth:
         username: <PROMETHEUS_USER>
         password: <GRAFANA_TOKEN>
Note: In the Azure AKS blueprint, these values are placeholder tokens that must be replaced with the actual Prometheus endpoint credentials before deployment.
7. Node and Host Telemetry — node-exporter
node-exporter collects operating-system and kernel metrics from each Kubernetes worker node. It runs as a DaemonSet, which means one instance is automatically scheduled on each worker node. As nodes are added to the cluster, Kubernetes deploys a new node-exporter instance there automatically — observability coverage expands with the cluster without manual intervention.
node-exporter is not part of the Fabric pod. It is a separate cluster observability component that runs on the worker node itself, providing host-level signals:
- CPU utilization and saturation
- Memory usage and pressure
- Filesystem consumption and availability
- Disk I/O
- Network throughput and errors
- Operating system and kernel counters
These signals allow operators to distinguish between a Fabric-level problem and a node-level resource constraint — a distinction that is not possible from JVM metrics alone.
Important: node-exporter exposes a very large number of metric families by default. Without filtering, it is one of the most common sources of excessive metric volume. Apply metric_relabel_configs or River pipeline filtering rules to retain only the families that support operational monitoring. See How to Control Metric Volume with Filtering and Relabeling.
8. Kubernetes State Telemetry — kube-state-metrics
kube-state-metrics provides visibility into what Kubernetes knows about objects and workloads in the cluster. Unlike node-exporter, it does not read host operating system metrics — it reflects Kubernetes control plane state.
kube-state-metrics runs as a cluster-level singleton. It does not need to run once per node because it talks to the Kubernetes API server, not to individual nodes. One instance provides cluster-wide object state visibility.
Key signals from kube-state-metrics:
- Pod readiness and phase state
- Pod restart counts
- Deployment convergence and replica status
- Node readiness and conditions
- Drift between desired and actual state
This is the layer that explains why an apparently healthy Fabric JVM may still be part of an unhealthy service from Kubernetes' perspective — for example, a pod in a restart loop or a deployment that has not converged.
Note: kube-state-metrics label and annotation metrics can have very high cardinality in clusters where pods carry many labels. Review and filter these families carefully. See How to Control Metric Volume with Filtering and Relabeling.
9. Log Collection — Grafana Agent
In Kubernetes deployments, Grafana Agent handles log collection alongside metrics. It is not a separate promtail deployment. Grafana Agent tails pod logs from the cluster and forwards them to Loki.
The Loki endpoint is configured in the Grafana Agent values file alongside the Prometheus endpoint:
externalServices:
   loki:
      host: <LOKI_URL>
      basicAuth:
         username: <LOKI_USER>
         password: <GRAFANA_TOKEN>
This is architecturally different from the VM model, where a standalone promtail process runs on the Fabric host and is configured by promtail_config.sh. In Kubernetes, Grafana Agent handles both metrics and logs as a unified collector.
Logs and metrics remain separate telemetry types within Grafana Agent — they are collected and forwarded through different pipelines to different backends. But from an operational perspective, both are managed through the same Helm chart and values configuration.
10. Observability Namespace
Each monitored Kubernetes cluster has a dedicated observability namespace. This namespace is the local home for all monitoring infrastructure. Workload namespaces contain the Fabric pods and other application components. The observability namespace contains the systems that discover, collect, store, and forward telemetry from those workloads.
The observability namespace typically contains:
- Grafana Agent — metrics scraping and log collection
- Prometheus — time-series storage, receives remote-write from Grafana Agent
- Thanos sidecar — exposes local Prometheus data to central Thanos Query
- Loki — log storage and query backend (may be central or per-cluster)
This bundle is deployed per monitored cluster. When a new cluster is added, the same observability namespace pattern is deployed into it and enrolled in the Thanos federation. Observability coverage is repeatable and consistent across clusters.
Note: The observability namespace described here reflects the K2view monitoring model. In practice, the exact namespace name and component layout may vary by deployment. The important principle is the separation between workload namespaces and the monitoring control plane.
11. Filtering, Relabeling, and Cardinality Control
Grafana Agent applies filtering and relabeling to scraped metrics before remote-writing to Prometheus. This is the primary mechanism for controlling metric volume, active series count, and storage growth.
The K2view model keeps the Fabric exporter configuration minimal and applies observability policy in the collection layer — in this case, in the Grafana Agent River pipeline. This centralizes scale control where storage consequences are visible.
Key principles:
- Filter by metric family: keep only the families used in dashboards and alerts (fabric_, jvm_, tomcat_*, node CPU/memory/disk families, key kube-state-metrics families)
- Reduce label cardinality: drop labels that are not used in aggregations or alert conditions
- Monitor active series: prometheus_tsdb_head_series is the primary Prometheus health signal — it reflects true storage and query footprint
- Review retention: effective retention depends on both the configured time window and storage capacity — filter aggressively enough that the time window is not cut short by storage pressure
For detailed guidance and River pipeline syntax, see How to Control Metric Volume with Filtering and Relabeling.
12. Thanos Cross-Cluster Federation
Each monitored cluster has a local Prometheus instance with a Thanos sidecar. A central Thanos Query layer federates across all per-cluster Prometheus instances, providing a unified view across AKS (Azure), GKE (GCP), and EKS (AWS) deployments.
The model preserves local collection:
- Grafana Agent scrapes within the cluster
- Prometheus stores and indexes locally
- Thanos sidecar exposes the local store to the central query layer
- Thanos Query federates without duplicating or centralizing ingestion
This means local observability — cluster-local dashboards, per-cluster troubleshooting, per-cluster alert rules — remains fully functional without a dependency on the central Thanos layer. Thanos provides the additional cross-cluster view above that.
Operationally, new clusters are added by deploying the same local observability stack and Thanos sidecar pattern into the new cluster. No changes to the central Thanos Query layer are required beyond enrolling the new sidecar.
Note: The Terraform blueprints (AKS, GKE, EKS) deploy Grafana Agent as the local scraper. The Thanos layer sits above what the blueprints configure and is managed separately as part of the central observability infrastructure.
13. Configuration Flow
The following sequence describes the setup for each monitored Kubernetes cluster.
13.1 Per Cluster — Observability Stack
- Deploy the Grafana Agent k8s-monitoring Helm chart into the observability namespace
- Configure the Grafana Agent values file with the Prometheus remote-write endpoint and Loki endpoint
- Configure Grafana Agent to discover and scrape Fabric pods on port 7170 (annotation-based or explicit River pipeline)
- Confirm Grafana Agent is scraping by checking pod logs
- Confirm metrics are flowing to Prometheus
- Deploy or confirm Thanos sidecar is running alongside Prometheus
- Enroll the cluster's Thanos sidecar in the central Thanos Query layer
13.2 Per Space — Fabric Monitoring
- Confirm with K2view that monitoring is enabled in your space profile
- Confirm MONITORING=default is present in the Fabric pod environment
- Confirm fabric_7_monitor.sh has run and the javaagent line is present in jvm.options
- Validate the Fabric metrics endpoint from inside the pod:
kubectl exec -it <fabric-pod> -n <namespace> -- curl http://localhost:7170/metrics
- Confirm Grafana Agent is discovering and scraping the Fabric pod
14. What the Consumer Sees
A consuming Grafana environment sees the output of the full observability stack, not just the Fabric exporter in isolation:
- Fabric and JVM metrics — application health, memory, GC, threads, Fabric product counters
- Host and node metrics — CPU, memory, filesystem, network from node-exporter
- Kubernetes workload and state metrics — pod health, restarts, deployment state from kube-state-metrics
- Logs — detailed event context from Grafana Agent log collection via Loki
- Cross-cluster views — fleet-level health across AKS, GKE, and EKS via Thanos Query
In Grafana, this allows operators to move from a product-level metric anomaly to node-level resource pressure to pod state changes to the underlying log evidence — all within one operational view, without switching between tools.
The same metrics surface can also be consumed by third-party platforms. See How to Use the Shipped JMX Exporter with Third-Party Monitoring Platforms.
15. Operational Considerations
15.1 Troubleshoot Locally First
The monitoring model is local-first. If metrics are missing from a higher-level view, the first checks should be local:
- Is the JMX Exporter active? Curl localhost:7170/metrics from inside the pod
- Is MONITORING=default set in the pod? kubectl exec
-- env | grep MONITORING - Is Grafana Agent discovering the pod? Check Grafana Agent logs
- Is Grafana Agent remote-writing successfully? Check for remote-write errors in agent logs
- Is Prometheus receiving and storing the metrics? Query Prometheus directly
- Is the Thanos sidecar healthy? Check sidecar pod status in the observability namespace
15.2 Metrics and Logs Are Complementary
Metrics are optimized for alerting and trend analysis. Logs are optimized for detail and explanation. In the Kubernetes model, both are collected by Grafana Agent and surfaced in Grafana — but they should not be treated as interchangeable. Use metrics to identify anomalies; use logs to explain them.
15.3 Retention Depends on Volume Control
Prometheus retention has two limits: time and storage. Whichever is reached first determines effective retention. Without filtering, node-exporter and kube-state-metrics in particular can generate enough series to significantly reduce effective retention. Filtering is not optional.
15.4 Responsibility Boundaries
K2view defines the metrics surface and the architecture. The consuming monitoring team owns dashboards, alerts, retention choices, and operationalization. For third-party platform integrations, K2view's responsibility ends at the /metrics endpoint.
Appendix A: Component Roles
Appendix B: Key Ports
- 7170 — Fabric JMX Exporter (/metrics)
- 7270 — iid_finder JMX Exporter (/metrics)
- 9100 — node-exporter (/metrics)
- 9090 — Prometheus
- 3100 — Loki
Appendix C: Key Environment Variables
- MONITORING — Set to 'default' or 'true' to enable the monitor setup chain at container startup. Injected by K2cloud Orchestrator when monitoring is enabled in the space profile (managed by K2view). You can verify its presence in a running pod with: kubectl exec
-- env | grep MONITORING. - LOKI_HOST — Not used in Kubernetes deployments. Grafana Agent handles log forwarding; standalone Promtail is not used.
Related Topics
- K2view Observability Architecture for Fabric
- K2view VM / Bare-Metal Monitoring Stack for Fabric
- How to Enable the JMX Exporter for Fabric
- How to Verify That Fabric Is Exposing Metrics
- How to Configure the Collection Layer to Scrape Fabric Metrics
- How to Control Metric Volume with Filtering and Relabeling
- How to Use the Shipped JMX Exporter with Third-Party Monitoring Platforms
