


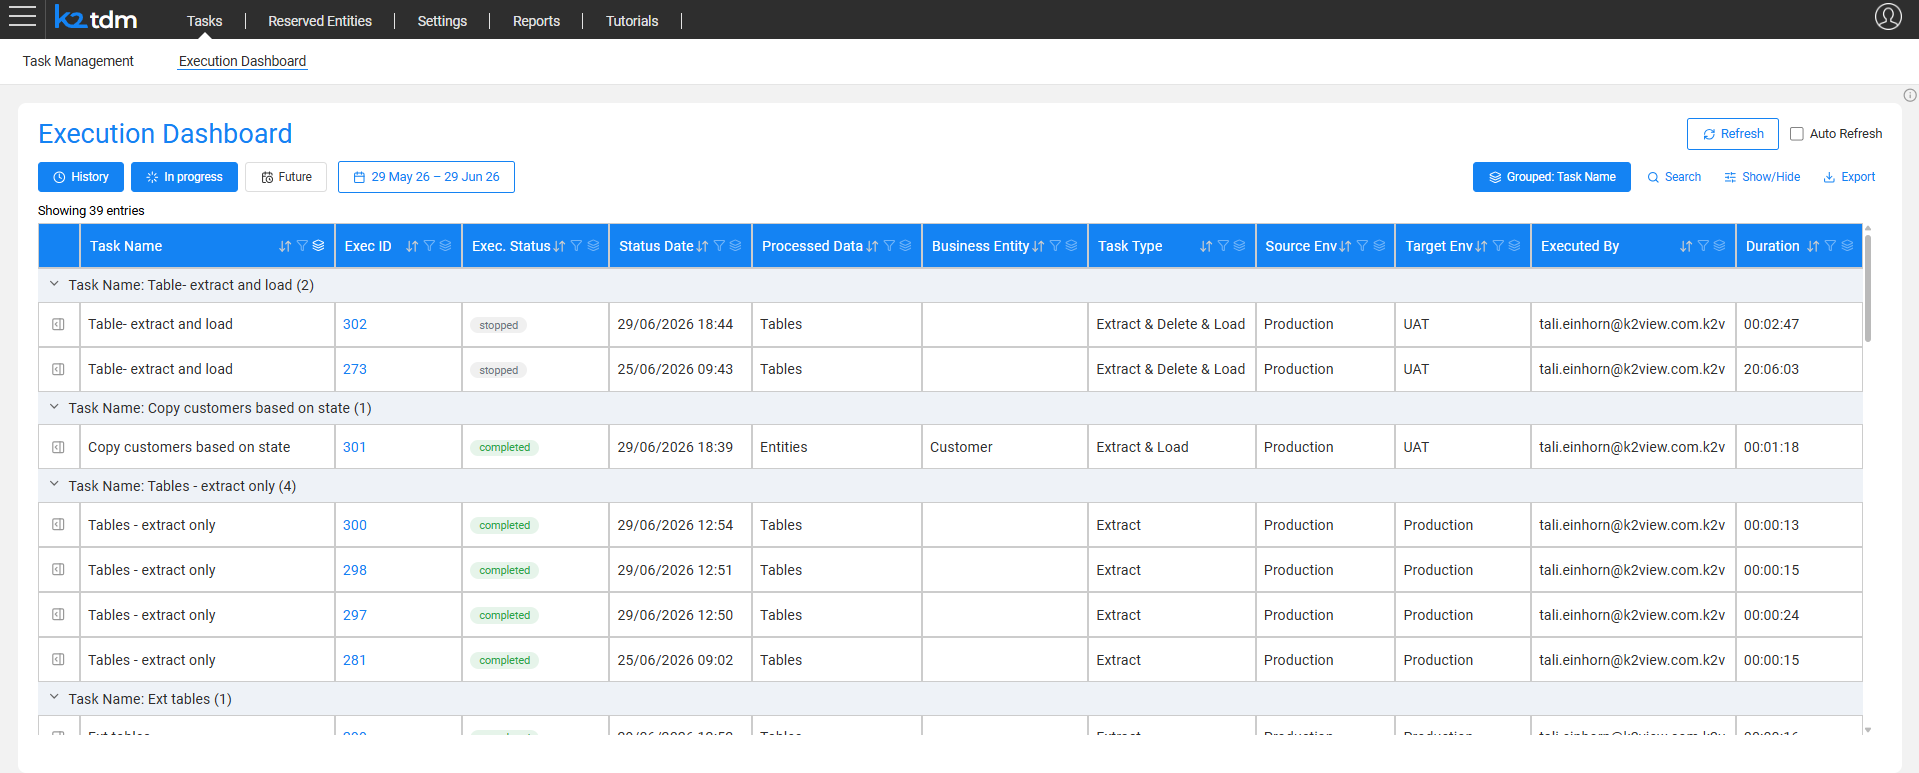
Execution Dashboard Window
The Execution Dashboard is the unified operations center for monitoring and managing TDM task executions. It replaces the scattered per-task execution views of previous TDM versions, providing a single window to monitor live executions, review execution history, view upcoming scheduled executions, download reports, and rerun previous executions — all in one place.
The dashboard is accessible in two ways:
- From the Tasks navigation bar by selecting the Execution Dashboard tab.
- By clicking the Previous executions button in the task execution window. In this case, the dashboard opens pre-filtered to show only executions of that specific task.
Who Can View What?
Each user sees only the executions relevant to them:
- Admin users — view all executions across all environments and tasks.
- Environment owners — view executions for tasks running on their environments.
- Testers — view their own executions only.
Views
The dashboard provides three views, toggled by the buttons at the top-left:
- History — displays past executions within a selected date range. Use the date range picker to control the time window.
- In progress — displays executions that are currently running or pending.
- Future — displays upcoming executions for scheduled tasks.
Filtering, Sorting, and Grouping
The table supports sorting and filtering on any column. By default, executions are grouped by Task Name, so all executions of the same task appear together under a collapsible group header showing the task name and the number of executions in the group. Click a group header to expand or collapse it.
When grouping is active, the button label shows the active grouping fields (e.g., Grouped: Task Type, Business Entity). When no grouping is active, the button shows Group By. Click the button to open the grouping panel, where you can:
- Check one or more fields to group by them. Multiple fields create a hierarchical grouping — for example, grouping by Task Type and then Business Entity nests the Business Entity groups inside each Task Type group.
- Uncheck a field to remove that grouping level.
- Click Clear grouping to remove all grouping and display a flat list.
The available grouping fields are: Task Name, Exec. Status, Task Type, Business Entity, Source Env, Target Env, and Executed By.
Use the Search field to perform a free-text search across executions.
Columns
The table includes a set of default columns. Click Show/Hide to add optional columns to the view. The available optional columns include: Task ID, Selection Method, Processed Entities, Completed Entities, Failed Entities, Processed Tables, Completed Tables, and Failed Tables.
Export
Click Export to export the current table view to a CSV file.
Refresh
- Refresh — manually refreshes the dashboard.
- Auto Refresh — when checked, the dashboard refreshes automatically, keeping live execution status up to date.
Execution Record Actions
Click the icon on the left of any execution row to open a side panel with details and actions for that execution. The panel displays:
- Task name and Exec ID as the panel title.
- Selection method — the entity selection method used for this execution.
- Notes — the execution note entered at execution time, if populated.
The panel provides the following action links:
- Download report — downloads the execution report.
- Execution monitor — opens the Execution Summary & Monitor for the execution.
- Open task execution — opens the task execution window to view execution details or rerun the execution.
