Task Execution History
The TDM GUI has several windows that display a task's execution history:
- Task Execution Summary, displays a list of the task's executions.
- Logical Units Execution Summary, displays a list of a task's LUs and post execution processes.
- Task Execution- Detailed Statistics, displays the hierarchical structure of copied and failed entities of an executed task.
Task Executions Summary
The Task Executions Summary displays a list of executed tasks. When a task is edited a new version of the task is created. Each version has its own record in the Tasks Lists window and has its own Task Execution Summary.
Open the Tasks List window and click the ![]() next to a selected task to open its Task Execution Summary window and display a full list of the task's executions:
next to a selected task to open its Task Execution Summary window and display a full list of the task's executions:

Click Show/Hide Columns to open a popup window displaying a list of available fields for each task. Fields in green are displayed by default. Click a field to remove it from the display.
The following information is displayed for each executed task:
- Task_execution_id.
- Source and target environments.
- Task Executed By, the name of the user executing the task.
- BE name.
- Summary statistics about the processed entities, Reference tables and post execution processes.
- Execution status, which is set to Completed when all a task's processes have been completed successfully.
Generating a Task Execution Summary Report
Click![]() next to each executed task to generate and download a Summary Execution report.
next to each executed task to generate and download a Summary Execution report.
Example of Summary Execution Report:
summary execution report example
Logical Units Execution Summary
Displays an executed task's LUs and post execution processes. To display the Logical Units Execution Summary, click a task's Task Execution Id setting in the Task Execution Summary window.

Click Show/Hide Columns to open a popup window displaying a list of available fields for each task. Fields in green are displayed by default. Click a field to remove it from the display.
The window displays a summary on each LU or post execution process of an executed task.
Generating a Task Execution Report on each Process
Load Tasks
The execution report displays the following information about the LU execution:
- General information.
- Entities list.
- Reference tables list.
- Execution errors.
- Replaced sequences.
To generate and download a Summary Execution Report on an LU, click the ![]() next to each LU.
next to each LU.
Extract Tasks
Summary Report
The Summary Report displays the following:
- Batch Command that syncs entities into Fabric.
- A summary of an executed task's data on each Fabric node and Fabric cluster.
To generate and download a summary report on an LU's execution, click  .
.
Detailed Report
A Detailed Report displays the entities and Reference tables list, their execution status and error message if the execution of a given entity or Reference table fails.
To generate and download a Summary Report on an LU's execution, click  .
.
Task Execution - Detailed Statistics
The Task Execution - Detailed Statistics window displays the following:
- Detailed information on the number of copied and failed entities and Reference tables in a task execution.
- The hierarchical structure of the LUs and their entities.
- A sample list of copied and failed entities and Reference tables.
- Search option used to search for an entity.
To display the Task Execution - Detailed Statistics window, click ![]() in the right corner of the Logical Units Execution Summary window.
in the right corner of the Logical Units Execution Summary window.
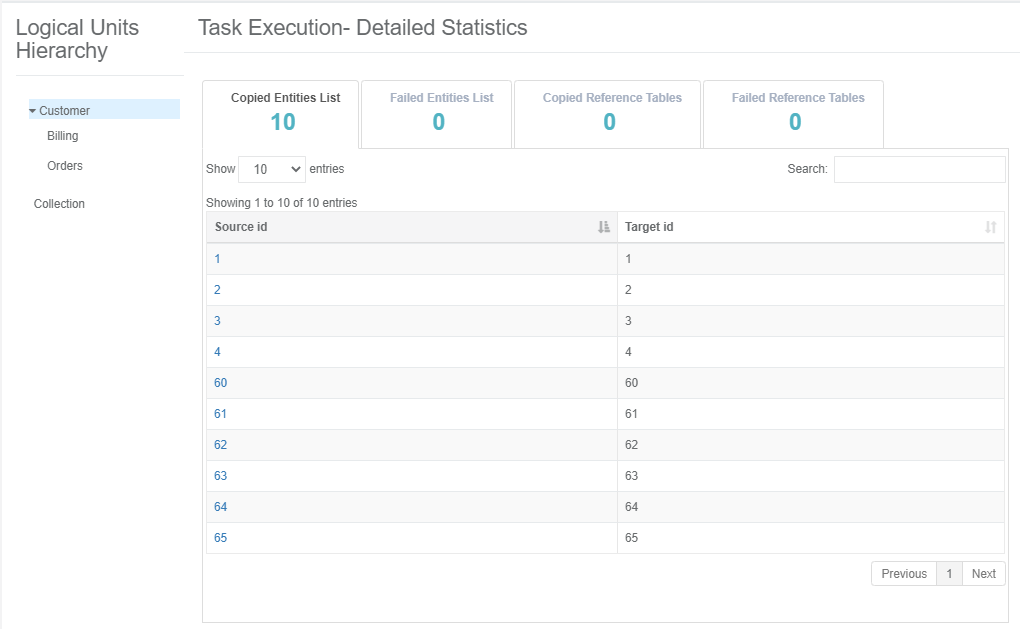
- The left pane displays the hierarchical tree of the task's LU.
- The right pane displays the number of copied and failed entities and Reference tables and a sample of entities and Reference tables.
By default, the root LU's list of entities and Reference tables is displayed. To view the entities and Reference tables in the Logical Units Hierarchy, click the LU.
The Source ID and Target ID sequences are displayed for each entity ID. When the task replaces the source sequences, the Target ID and Source ID can be different. If an LU in the tree has failed entities it is marked in red.
Failed Entities List Tab
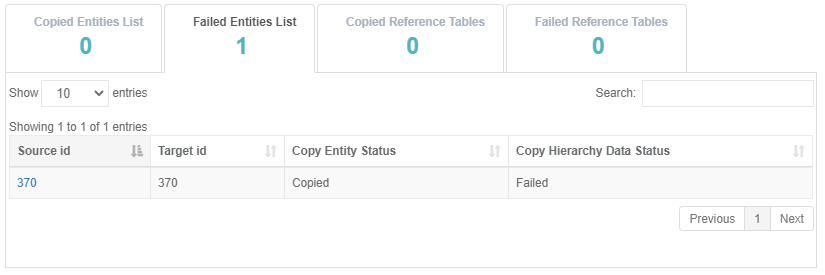
An entity is marked as Failed if its process fails or if a child ID fails. For example, a Customer ID is marked as Failed if a copy of an order fails. The Failed Entities List tab displays both statuses:
- Copy Entity Status, marked as Failed if the task execution fails to process the entity ID.
- Copy Hierarchy Data Status, marked as Failed if the task execution fails to process a child ID.
View the Hierarchy of a Selected Entity
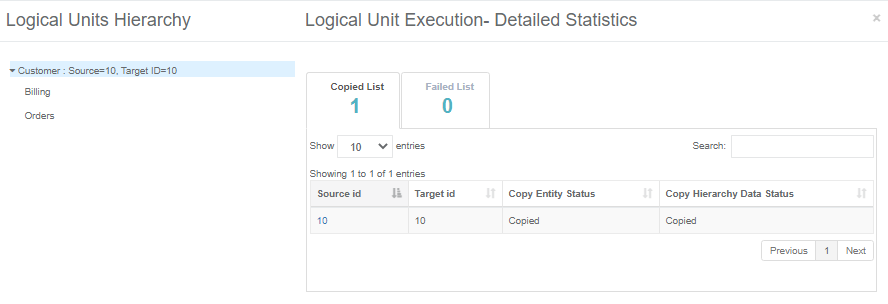
Click the Source Id setting of an entity to view its hierarchy.
Example:
View Customer #10:
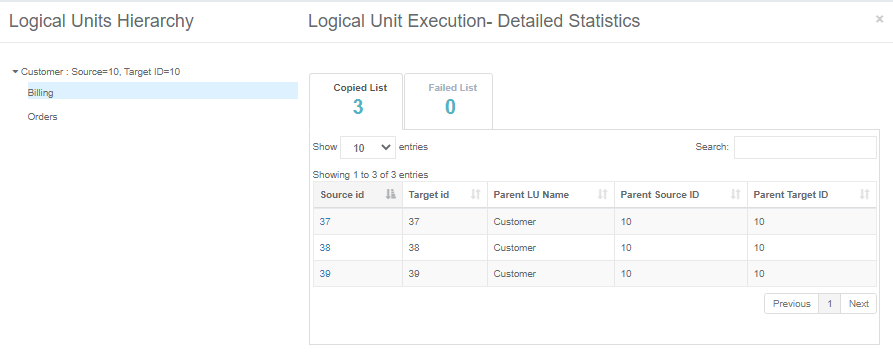
Click the Billing LU to view the Subscriber IDs of Customer #10:
Click the Orders LU to view the Order IDs of Customer #10:
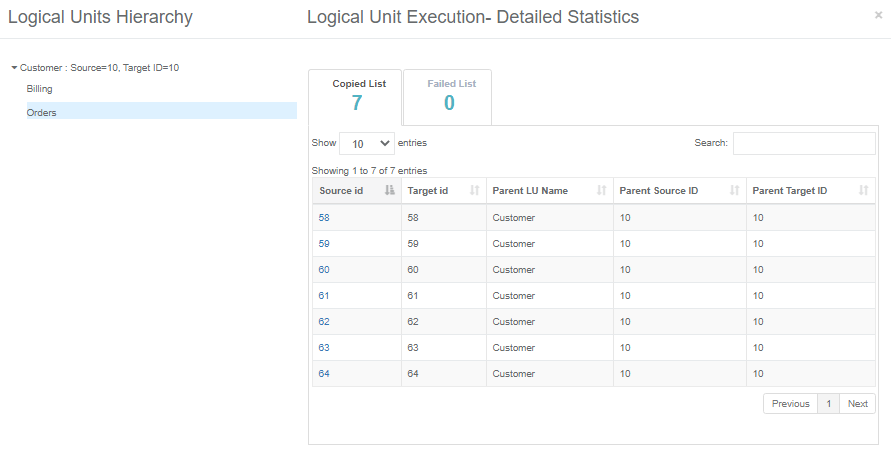
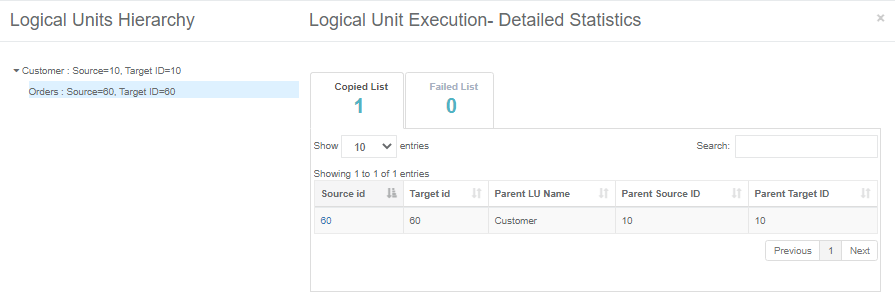
Click the child Order ID - Order #60 - to view its hierarchical structure:
Task Execution History
The TDM GUI has several windows that display a task's execution history:
- Task Execution Summary, displays a list of the task's executions.
- Logical Units Execution Summary, displays a list of a task's LUs and post execution processes.
- Task Execution- Detailed Statistics, displays the hierarchical structure of copied and failed entities of an executed task.
Task Executions Summary
The Task Executions Summary displays a list of executed tasks. When a task is edited a new version of the task is created. Each version has its own record in the Tasks Lists window and has its own Task Execution Summary.
Open the Tasks List window and click the ![]() next to a selected task to open its Task Execution Summary window and display a full list of the task's executions:
next to a selected task to open its Task Execution Summary window and display a full list of the task's executions:

Click Show/Hide Columns to open a popup window displaying a list of available fields for each task. Fields in green are displayed by default. Click a field to remove it from the display.
The following information is displayed for each executed task:
- Task_execution_id.
- Source and target environments.
- Task Executed By, the name of the user executing the task.
- BE name.
- Summary statistics about the processed entities, Reference tables and post execution processes.
- Execution status, which is set to Completed when all a task's processes have been completed successfully.
Generating a Task Execution Summary Report
Click![]() next to each executed task to generate and download a Summary Execution report.
next to each executed task to generate and download a Summary Execution report.
Example of Summary Execution Report:
summary execution report example
Logical Units Execution Summary
Displays an executed task's LUs and post execution processes. To display the Logical Units Execution Summary, click a task's Task Execution Id setting in the Task Execution Summary window.

Click Show/Hide Columns to open a popup window displaying a list of available fields for each task. Fields in green are displayed by default. Click a field to remove it from the display.
The window displays a summary on each LU or post execution process of an executed task.
Generating a Task Execution Report on each Process
Load Tasks
The execution report displays the following information about the LU execution:
- General information.
- Entities list.
- Reference tables list.
- Execution errors.
- Replaced sequences.
To generate and download a Summary Execution Report on an LU, click the ![]() next to each LU.
next to each LU.
Extract Tasks
Summary Report
The Summary Report displays the following:
- Batch Command that syncs entities into Fabric.
- A summary of an executed task's data on each Fabric node and Fabric cluster.
To generate and download a summary report on an LU's execution, click  .
.
Detailed Report
A Detailed Report displays the entities and Reference tables list, their execution status and error message if the execution of a given entity or Reference table fails.
To generate and download a Summary Report on an LU's execution, click  .
.
Task Execution - Detailed Statistics
The Task Execution - Detailed Statistics window displays the following:
- Detailed information on the number of copied and failed entities and Reference tables in a task execution.
- The hierarchical structure of the LUs and their entities.
- A sample list of copied and failed entities and Reference tables.
- Search option used to search for an entity.
To display the Task Execution - Detailed Statistics window, click ![]() in the right corner of the Logical Units Execution Summary window.
in the right corner of the Logical Units Execution Summary window.

- The left pane displays the hierarchical tree of the task's LU.
- The right pane displays the number of copied and failed entities and Reference tables and a sample of entities and Reference tables.
By default, the root LU's list of entities and Reference tables is displayed. To view the entities and Reference tables in the Logical Units Hierarchy, click the LU.
The Source ID and Target ID sequences are displayed for each entity ID. When the task replaces the source sequences, the Target ID and Source ID can be different. If an LU in the tree has failed entities it is marked in red.
Failed Entities List Tab
An entity is marked as Failed if its process fails or if a child ID fails. For example, a Customer ID is marked as Failed if a copy of an order fails. The Failed Entities List tab displays both statuses:
- Copy Entity Status, marked as Failed if the task execution fails to process the entity ID.
- Copy Hierarchy Data Status, marked as Failed if the task execution fails to process a child ID.

View the Hierarchy of a Selected Entity
Click the Source Id setting of an entity to view its hierarchy.
Example:
View Customer #10:

Click the Billing LU to view the Subscriber IDs of Customer #10:

Click the Orders LU to view the Order IDs of Customer #10:

Click the child Order ID - Order #60 - to view its hierarchical structure:


 ]()
]()