

JMX Fabric Built-In Statistics
JMX statistics is presented as a single web page that displays each of the relevant statistics extracted from Fabric systems during runtime execution.
Access JMX Statistics
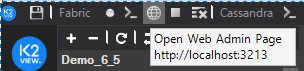
To access the Admin panel, click the Globe icon on the top left corner of the Fabric Studio.
Enter your Admin credentials in the Admin panel home page and then click Statistics in the left panel.
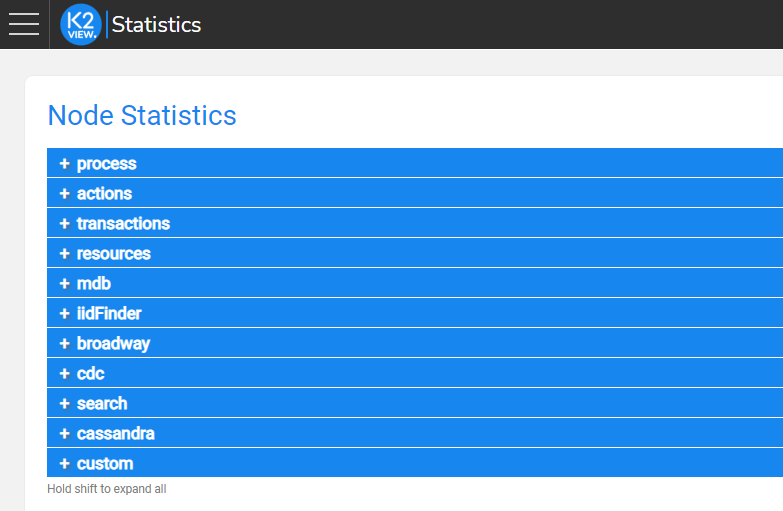
The following statistics sections can be viewed:
Processes
The information provided will feature statistics about the Loading phase of each of the components running in the current sessions:
Fabric Launch Sequence
since        56:38:23.041                    Time in miliseconds since the event last occured
timestamp    2020-12-10 12:34:39.733 UTC     The time, in miliseconds since 1970-1-1 00:00 UTC, this event last occured
Loading Common Area
since        56:38:23.730                    Time in miliseconds since the event last occured
timestamp    2020-12-10 12:34:39.045 UTC     The time, in miliseconds since 1970-1-1 00:00 UTC, this event last occured
Actions
In this section, statistics information like project deployment or Fabric commands are displayed:
Deployment count for a specific LU
count        1                               The number of times this event has occured
total        0:00:00.330                     The accumulated total of this event value
average        0:00:00.330                     The average of this event value since the process was launched
timestamp    2020-12-12 21:12:32.131 UTC     The time, in miliseconds since 1970-1-1 00:00 UTC, this event last occured
since        0:00:30.648                     Time in miliseconds since the event last occured
Count of Fabric Commands Executed
count        22                              The number of times this event has occured
timestamp    2020-12-12 21:13:02.638 UTC     The time, in miliseconds since 1970-1-1 00:00 UTC, this event last occured
since        0:00:00.141                     Time in miliseconds since the event last occured
GET
count        1                               The number of times this event has occured
timestamp    2020-12-12 21:12:54.676 UTC     The time, in miliseconds since 1970-1-1 00:00 UTC
since        0:00:08.104                     Time in miliseconds since the event last occured
Transactions
Statistics about Fabric jobs, get performances, Web Services, LUI queries and LU population sync are available in this section:
GET Duration
last            0:00:00.408                 The last value for this event
average            0:00:00.408                 The average of this event value since the process was launched
count            1                           The number of times this event has occured
timestamp        2020-12-12 21:12:55.092 UTC The time, in miliseconds since 1970-1-1 00:00 UTC
since            0:00:07.689                 Time in miliseconds since the event last occured
total            0:00:00.408                 The accumulated total of this event value
Web Services Calls
Executions as well as authentications statistics are also provided.
count                10                          The number of times this event has occured
total                0:00:04.684                 The accumulated total of this event value
average                0:00:00.468                 The average of this event value since the process was launched
timestamp            2020-12-12 21:13:02.642 UTC The time, in miliseconds since 1970-1-1 00:00 UTC
since                0:00:00.141                 Time in miliseconds since the event last occured
Resources
Statistics about general information on systems resources are displayed:
Number of LU in the systems
last            3                               The last value for this event
timestamp        2020-12-12 21:12:32.131 UTC     The time, in miliseconds since 1970-1-1 00:00 UTC
since            0:26:17.201                     Time in miliseconds since the event last occured
Number of Active Cassandra Sessions
total            1                               The accumulated total of this event value
count            1                               The number of times this event has occured
timestamp        2020-12-10 12:34:35.294 UTC     The time, in miliseconds since 1970-1-1 00:00 UTC
since            57:04:14.038                    Time in miliseconds since the event last occured
MicroDBs
Very useful information such as number of LUIs sync-ed, fetching times and sizes can be viewed here:
mdb Cache Count
last            3                               The last value for this event
timestamp        2020-12-12 21:38:39.802 UTC     The time, in miliseconds since 1970-1-1 00:00 UTC
since            0:00:09.533                     Time in miliseconds since the event last occured
mdb Fetch Bytes
count            3                               The number of times this event has occured
average            53248 B                         The average of this event value since the process was launched
total            156 KB                          The accumulated total of this event value
timestamp        2020-12-12 21:38:39.794 UTC     The time, in miliseconds since 1970-1-1 00:00 UTC
since            0:00:09.544                     Time in miliseconds since the event last occured
Broadway
Statistics about the Broadway flows with performance metrics per Flow / Stage / Actor / Iteration.
last        00:06.6     The last value for this event
average        00:02.1     The average of this event value since the process was launched
count        9           The number of times this event has occured
timestamp    2021-05-09 13:45:39.298 UTC
                        The time, in miliseconds
since        52:45.2     Time in miliseconds since the event last occured
total        00:19.1     The accumulated total of this event value


JMX Fabric Built-In Statistics
JMX statistics is presented as a single web page that displays each of the relevant statistics extracted from Fabric systems during runtime execution.
Access JMX Statistics
To access the Admin panel, click the Globe icon on the top left corner of the Fabric Studio.
Enter your Admin credentials in the Admin panel home page and then click Statistics in the left panel.
The following statistics sections can be viewed:
Processes
The information provided will feature statistics about the Loading phase of each of the components running in the current sessions:
Fabric Launch Sequence
since        56:38:23.041                    Time in miliseconds since the event last occured
timestamp    2020-12-10 12:34:39.733 UTC     The time, in miliseconds since 1970-1-1 00:00 UTC, this event last occured
Loading Common Area
since        56:38:23.730                    Time in miliseconds since the event last occured
timestamp    2020-12-10 12:34:39.045 UTC     The time, in miliseconds since 1970-1-1 00:00 UTC, this event last occured
Actions
In this section, statistics information like project deployment or Fabric commands are displayed:
Deployment count for a specific LU
count        1                               The number of times this event has occured
total        0:00:00.330                     The accumulated total of this event value
average        0:00:00.330                     The average of this event value since the process was launched
timestamp    2020-12-12 21:12:32.131 UTC     The time, in miliseconds since 1970-1-1 00:00 UTC, this event last occured
since        0:00:30.648                     Time in miliseconds since the event last occured
Count of Fabric Commands Executed
count        22                              The number of times this event has occured
timestamp    2020-12-12 21:13:02.638 UTC     The time, in miliseconds since 1970-1-1 00:00 UTC, this event last occured
since        0:00:00.141                     Time in miliseconds since the event last occured
GET
count        1                               The number of times this event has occured
timestamp    2020-12-12 21:12:54.676 UTC     The time, in miliseconds since 1970-1-1 00:00 UTC
since        0:00:08.104                     Time in miliseconds since the event last occured
Transactions
Statistics about Fabric jobs, get performances, Web Services, LUI queries and LU population sync are available in this section:
GET Duration
last            0:00:00.408                 The last value for this event
average            0:00:00.408                 The average of this event value since the process was launched
count            1                           The number of times this event has occured
timestamp        2020-12-12 21:12:55.092 UTC The time, in miliseconds since 1970-1-1 00:00 UTC
since            0:00:07.689                 Time in miliseconds since the event last occured
total            0:00:00.408                 The accumulated total of this event value
Web Services Calls
Executions as well as authentications statistics are also provided.
count                10                          The number of times this event has occured
total                0:00:04.684                 The accumulated total of this event value
average                0:00:00.468                 The average of this event value since the process was launched
timestamp            2020-12-12 21:13:02.642 UTC The time, in miliseconds since 1970-1-1 00:00 UTC
since                0:00:00.141                 Time in miliseconds since the event last occured
Resources
Statistics about general information on systems resources are displayed:
Number of LU in the systems
last            3                               The last value for this event
timestamp        2020-12-12 21:12:32.131 UTC     The time, in miliseconds since 1970-1-1 00:00 UTC
since            0:26:17.201                     Time in miliseconds since the event last occured
Number of Active Cassandra Sessions
total            1                               The accumulated total of this event value
count            1                               The number of times this event has occured
timestamp        2020-12-10 12:34:35.294 UTC     The time, in miliseconds since 1970-1-1 00:00 UTC
since            57:04:14.038                    Time in miliseconds since the event last occured
MicroDBs
Very useful information such as number of LUIs sync-ed, fetching times and sizes can be viewed here:
mdb Cache Count
last            3                               The last value for this event
timestamp        2020-12-12 21:38:39.802 UTC     The time, in miliseconds since 1970-1-1 00:00 UTC
since            0:00:09.533                     Time in miliseconds since the event last occured
mdb Fetch Bytes
count            3                               The number of times this event has occured
average            53248 B                         The average of this event value since the process was launched
total            156 KB                          The accumulated total of this event value
timestamp        2020-12-12 21:38:39.794 UTC     The time, in miliseconds since 1970-1-1 00:00 UTC
since            0:00:09.544                     Time in miliseconds since the event last occured
Broadway
Statistics about the Broadway flows with performance metrics per Flow / Stage / Actor / Iteration.
last        00:06.6     The last value for this event
average        00:02.1     The average of this event value since the process was launched
count        9           The number of times this event has occured
timestamp    2021-05-09 13:45:39.298 UTC
                        The time, in miliseconds
since        52:45.2     Time in miliseconds since the event last occured
total        00:19.1     The accumulated total of this event value
