

Discovery Job Execution Monitor
The purpose of the Discovery job execution monitor is to track the progress of the Discovery process. The monitoring provides valuable insights that can help to follow-up the job execution, displaying the progress per each step.
The monitor is split into the following areas:
- The Run
 icon is located at the top of the Monitor screen, and it is replaced by the Stop
  icon during the job execution. The monitor allows to start the job execution for the selected Data Platform, or to stop the job, when it is in progress.
 - The General Info area allows to select the Data Platform in order to retrieve details of the monitoring.
- The monitor shows the last execution for the given Data Platform, either throughout its progress or when completed.
- The Execution Time area shows the job's start time and its duration. If the job has been completed, the end time is displayed as well.
- The Error / Warnings area displays either the error (in case of a job failure) or the number of warnings received during the job execution, if any.
- The Execution Progress is the monitor's main area. It shows the progress of the job, including the completion percentage of each step and the number of elements found.
- The steps displayed in this area are dynamic, and they depend on the job configuration. The disabled plugins are not displayed.
- Each step has an indication whether it is in progress, not started or completed.
- Upon completion of the job, the monitor displays the version number and indicates whether a new version has been created or not.
The monitor displays the execution progress by using various icons, as follows:
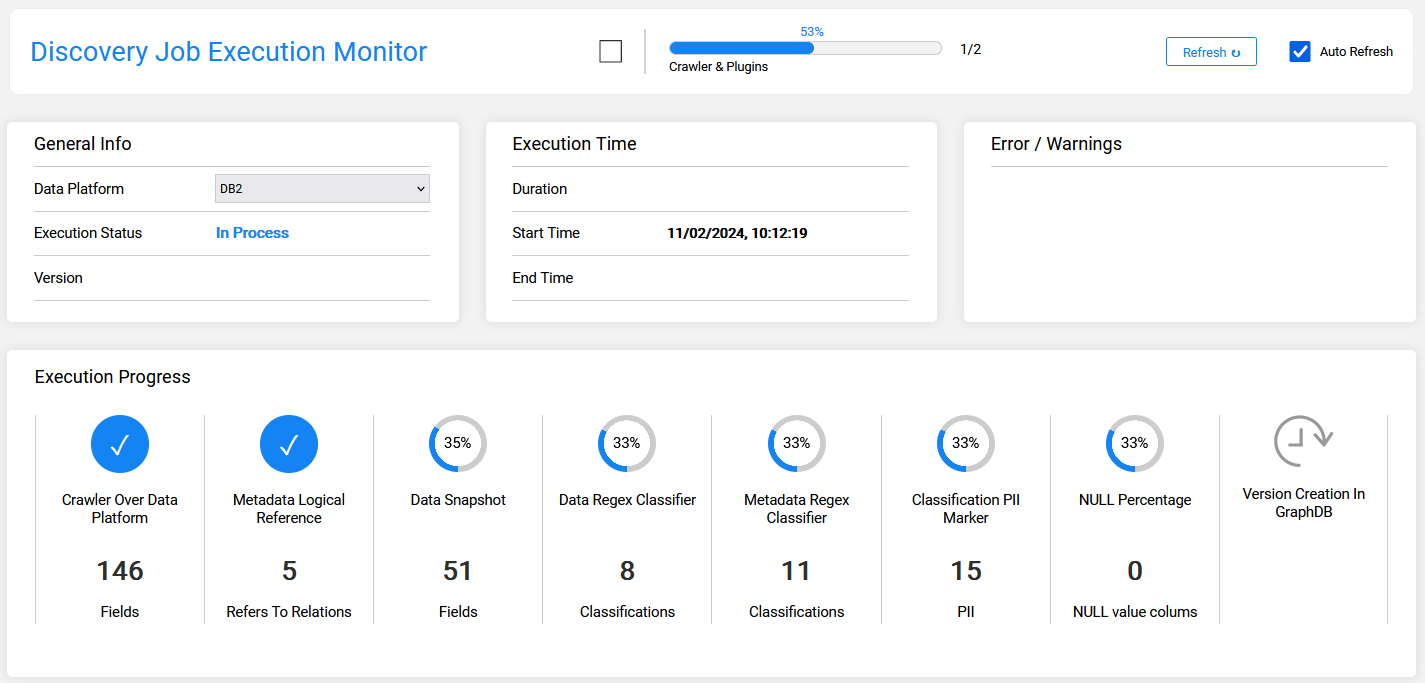
The following image shows the the job in progress:
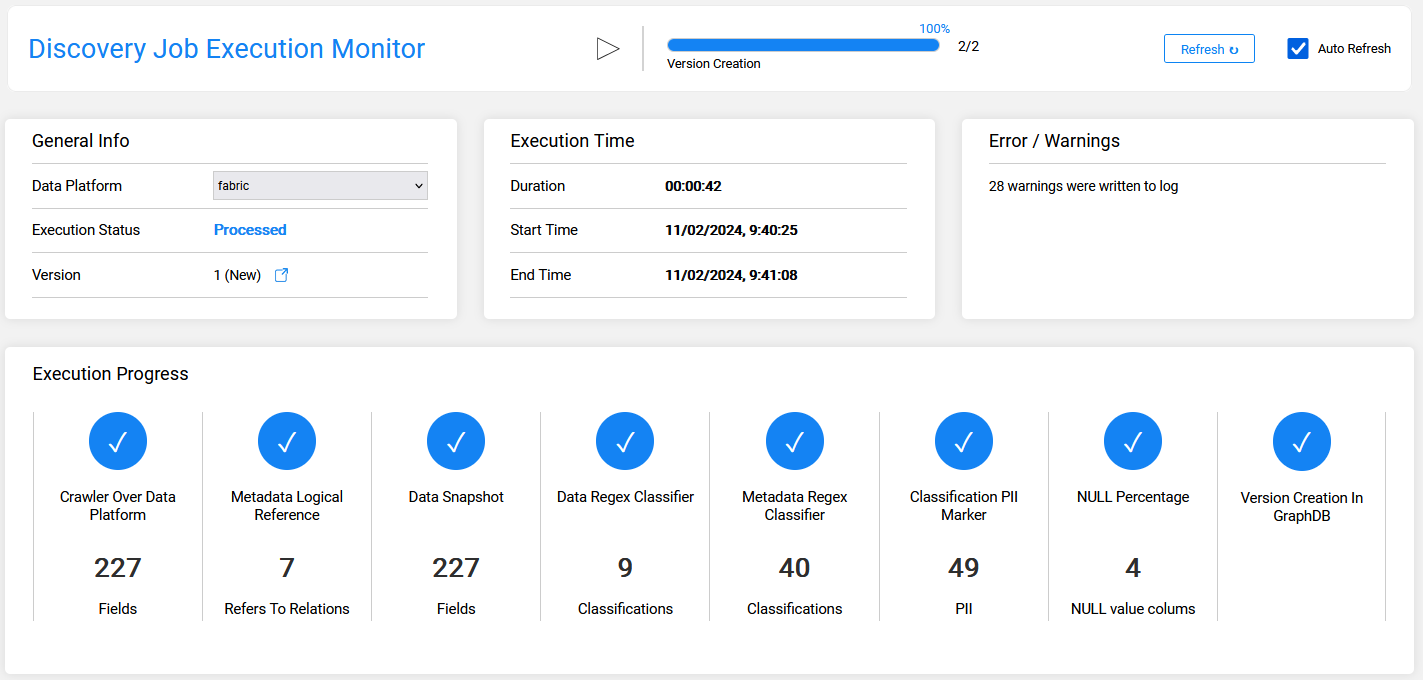
The following image shows that the job has been completed and a new version was created:
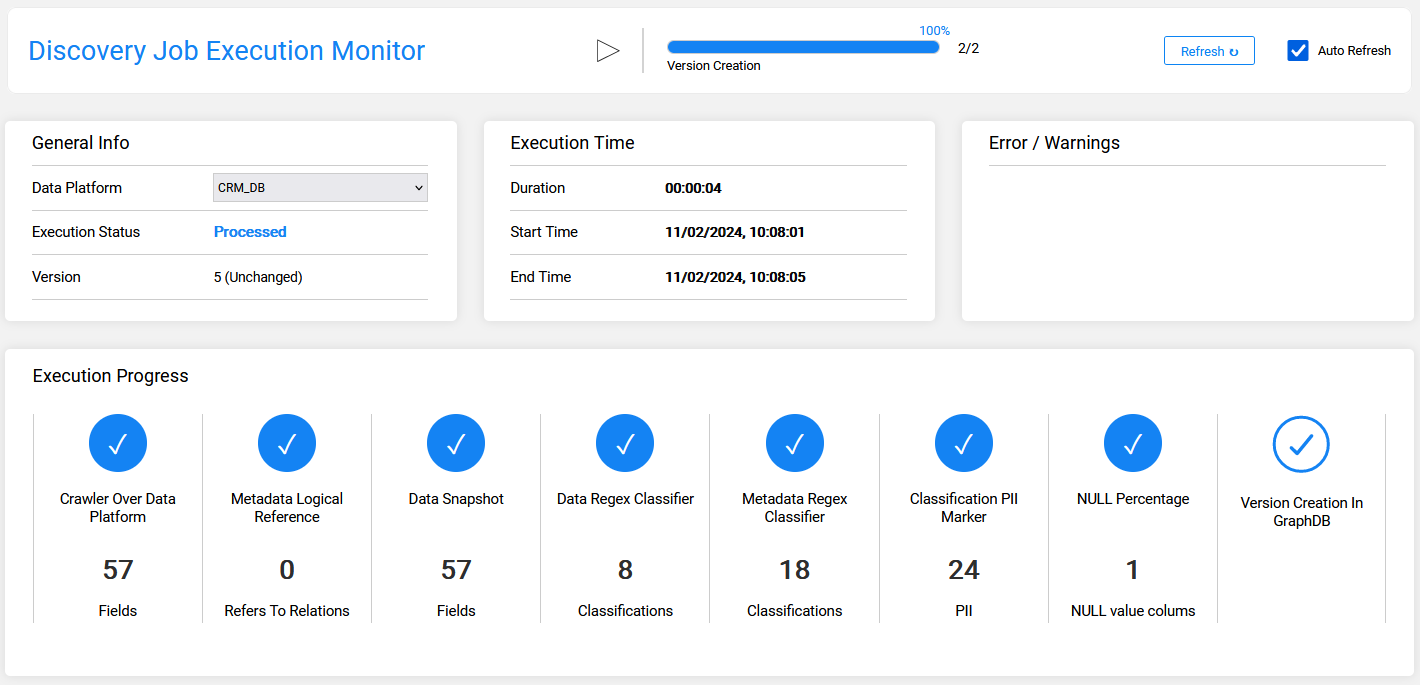
The following image shows that the job has been completed without creating a new version:


Discovery Job Execution Monitor
The purpose of the Discovery job execution monitor is to track the progress of the Discovery process. The monitoring provides valuable insights that can help to follow-up the job execution, displaying the progress per each step.
The monitor is split into the following areas:
- The Run icon is located at the top of the Monitor screen, and it is replaced by the Stop icon during the job execution. The monitor allows to start the job execution for the selected Data Platform, or to stop the job, when it is in progress.
- The General Info area allows to select the Data Platform in order to retrieve details of the monitoring.
- The monitor shows the last execution for the given Data Platform, either throughout its progress or when completed.
- The Execution Time area shows the job's start time and its duration. If the job has been completed, the end time is displayed as well.
- The Error / Warnings area displays either the error (in case of a job failure) or the number of warnings received during the job execution, if any.
- The Execution Progress is the monitor's main area. It shows the progress of the job, including the completion percentage of each step and the number of elements found.
- The steps displayed in this area are dynamic, and they depend on the job configuration. The disabled plugins are not displayed.
- Each step has an indication whether it is in progress, not started or completed.
- Upon completion of the job, the monitor displays the version number and indicates whether a new version has been created or not.
The monitor displays the execution progress by using various icons, as follows:
The following image shows the the job in progress:
The following image shows that the job has been completed and a new version was created:
The following image shows that the job has been completed without creating a new version:
