Task Execution History
The TDM Portal has several windows that display a task's execution history:
- Task Execution Summary - displays a list of the task's executions.
- Execution Summary - displays a list of a task's LUs and post-execution processes.
- Task Execution- Detailed Statistics - displays the hierarchical structure of successful and failed entities of an executed task.
Task Executions Summary
The Task Executions Summary displays a list of executed tasks. When a task is edited - a new version of the task is created. Each version has its own record in the Tasks Lists window as well as its own Task Execution Summary.
Open the Tasks List window and click the ![]() icon next to a selected task to open its Task Execution Summary window and display a full list of the task's executions.
icon next to a selected task to open its Task Execution Summary window and display a full list of the task's executions.
Click Show/Hide Columns to open a pop-up window, which displays a list of available fields for each task. Fields in green are displayed by default; click any one of them to remove it from the display.
The following information is displayed for each executed task:
Task_execution_id
Source and target environments
Task Executed By, which the name of the user executing the task.
BE name
Summary statistics about the processed entities, tables, pre-execution processes and post-execution processes.
Execution status, which is set to Completed when all of a task's processes have been completed successfully.
Generating a Task Executions Summary Report
Click![]() next to each executed task to generate and download a summary report. Note that the report displays the task execution overridden parameters, if they exist.
next to each executed task to generate and download a summary report. Note that the report displays the task execution overridden parameters, if they exist.
Click here to download an example of a summary report.
Executions Summary
This is a display of the LUs, pre-execution processes and post-execution processes for the selected task execution. To display the Logical Units Execution Summary, click a task's Task Execution Id setting in the Task Execution Summary window.
Click Show/Hide Columns to open a pop-up window, which displays a list of available fields for each task. Fields in green are displayed by default. Click a field to remove it from the display.
Generating a Task Execution Report on each Process
The execution report displays the following information about the LU execution:
- General information
- Entities list
- Tables list
- Execution errors
- Replaced sequences on Load tasks
To generate and download a Summary Execution Report on an LU, click the ![]() next to each LU.
next to each LU.
Note: The number of entities in the TDM execution report is limited to the number stated in the TDM_SUMMARY_REPORT_LIMIT Global (imported from the TDM library).
Task Execution - Detailed Statistics
Entity-based Task
The Task Execution - Detailed Statistics window displays the following:
- Detailed information on the number of successful and failed entities and tables in a task execution.
- The hierarchical structure of the LUs and their entities.
- A sample list of successful and failed entities.
- Successful and failed entities and tables.
- A search option used for searching an entity.
To display the Task Execution - Detailed Statistics window (shown below), click ![]() in the right corner of the Execution Summary window.
in the right corner of the Execution Summary window.
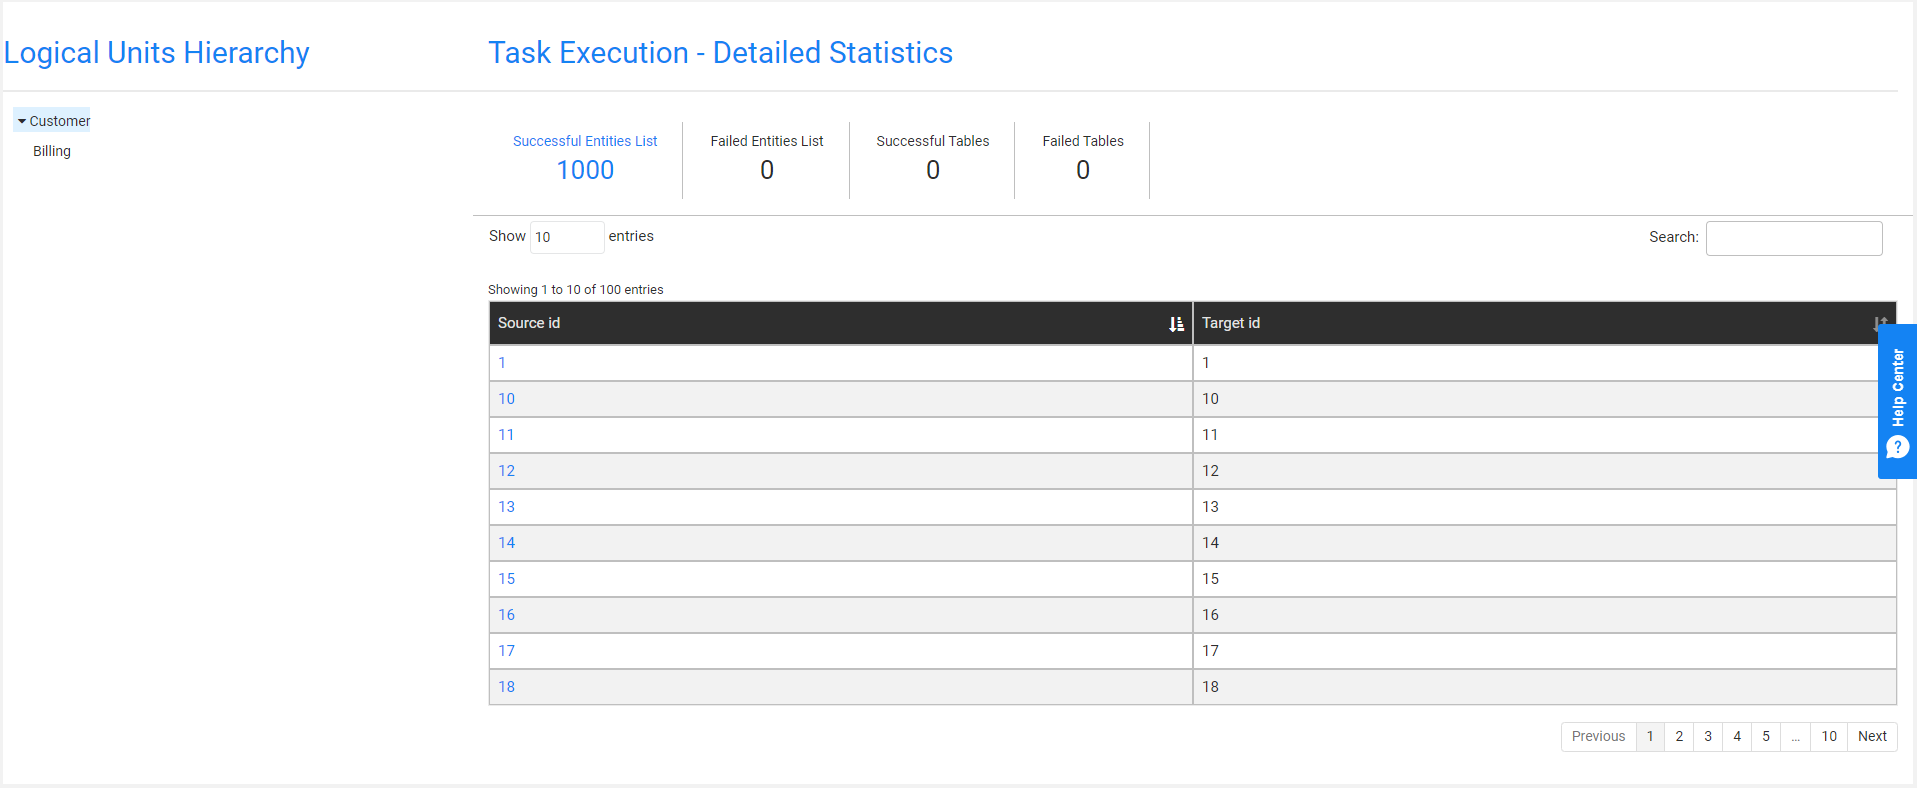
- The left pane displays the hierarchical tree of the task's LU.
- The right pane displays the number of successful and failed entities and tables and a sample of entities and tables.
By default, the root LU's list of entities and tables is displayed. To view the entities and tables in the Logical Units Hierarchy, click the LU.
The Source ID and Target ID sequences are displayed for each entity ID. When the task replaces the source IDs, the Target ID and Source ID can be different. If an LU in the tree contains failed entities, it is marked in red.
Failed Entities List Tab
An entity is marked as Failed if its process fails or if a child ID fails. For example, a Customer ID is marked as Failed if a copy of a billing subscriber fails. The Failed Entities List tab displays both statuses:
- Entity Status, marked as Failed if the task execution fails to process the entity ID.
- Hierarchy Data Status, marked as Failed if the task execution fails to process a child ID.

View the Hierarchy of a Selected Entity
Click the Source id setting of an entity to view its hierarchy.
Example:
View Customer #10:
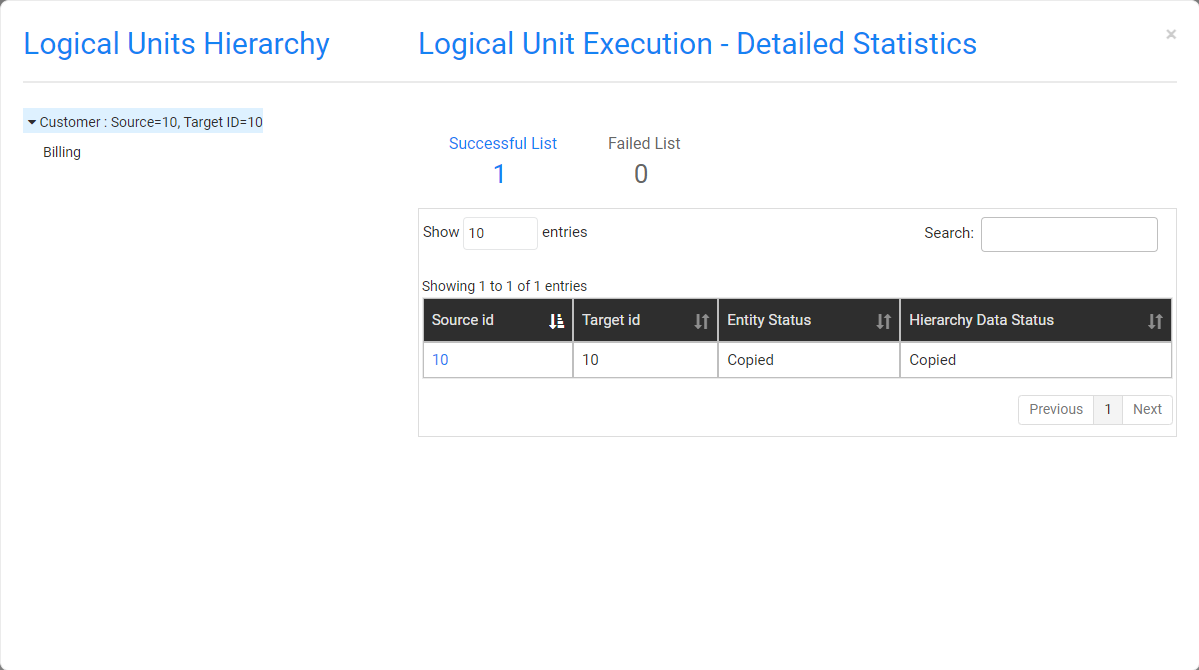
Click the Billing LU to view the Subscriber IDs of Customer #10:
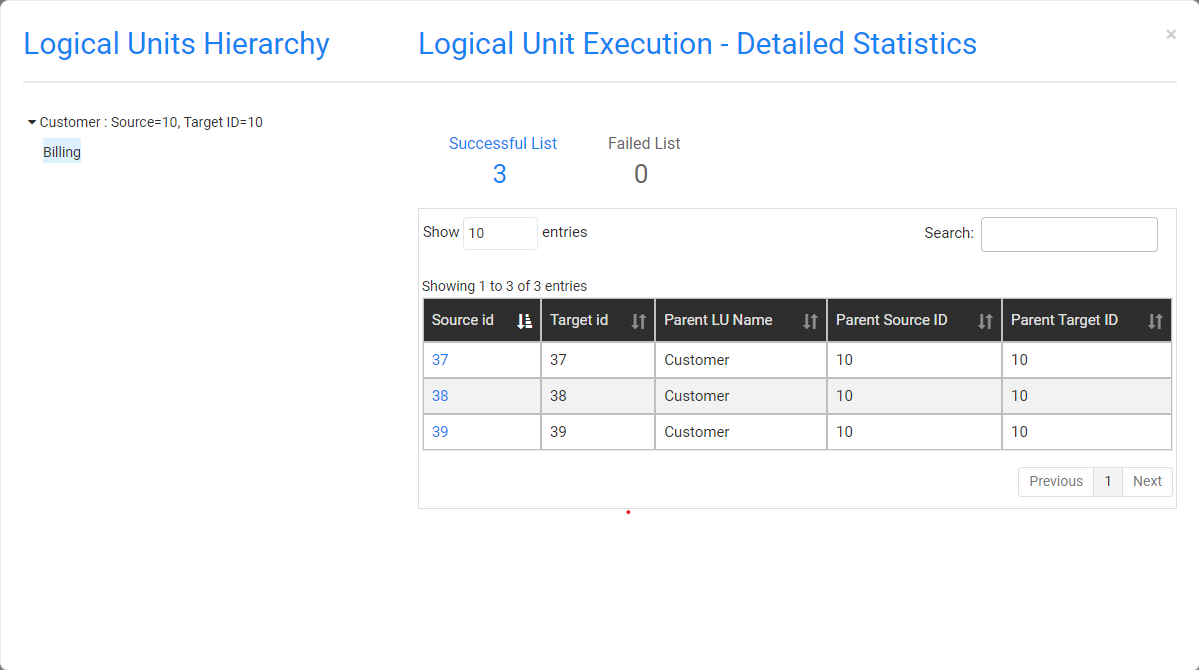
Click the child Billing subscriber ID - #37 - to view its hierarchical structure:
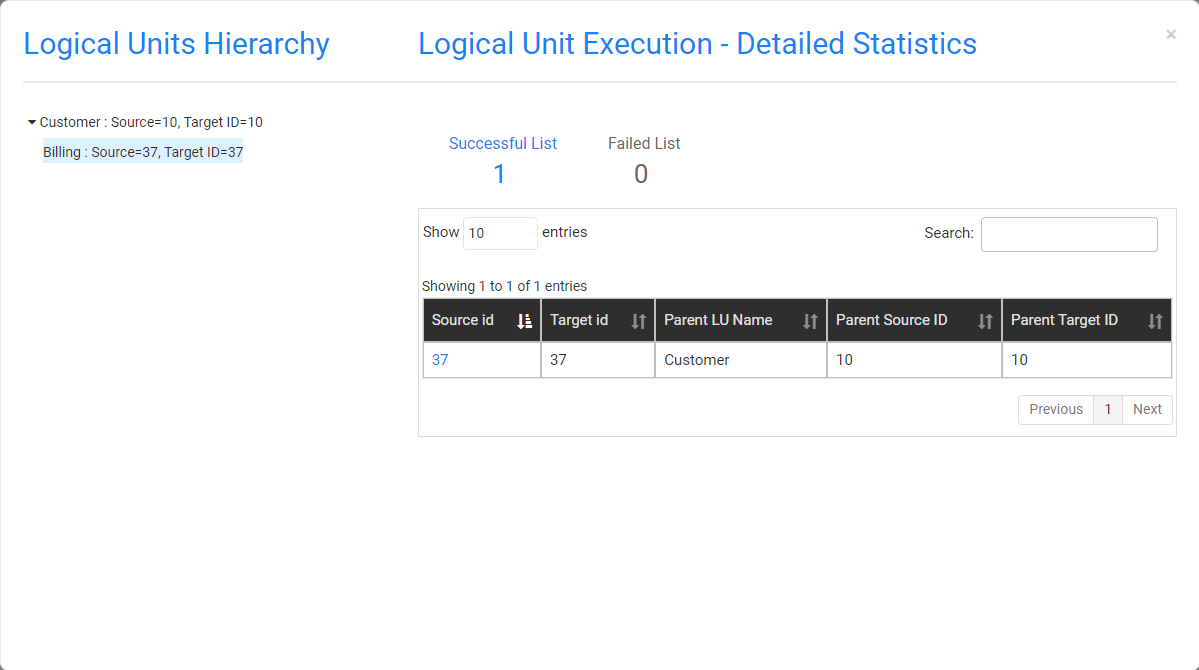
Table-based Task
When the user selected the Tables option in the task's Source component, the task is created and runs on tables without entities.
The Task Execution - Detailed Statistics window displays the following:
- Number of successful and failed tables in a task execution.
- List of successful and failed tables.
- Search option used for searching a table.
To display the Task Execution - Detailed Statistics window (shown below), click ![]() in the right corner of the Execution Summary window.
in the right corner of the Execution Summary window.
Successful Tables Tab
The following information is displayed for each successful table:
- Table name
- Number of records
View the below example:

Failed Tables Tab
The following information is displayed for each failed table:
- Table name
- Error message
View the below example:

Task Execution History
The TDM Portal has several windows that display a task's execution history:
- Task Execution Summary - displays a list of the task's executions.
- Execution Summary - displays a list of a task's LUs and post-execution processes.
- Task Execution- Detailed Statistics - displays the hierarchical structure of successful and failed entities of an executed task.
Task Executions Summary
The Task Executions Summary displays a list of executed tasks. When a task is edited - a new version of the task is created. Each version has its own record in the Tasks Lists window as well as its own Task Execution Summary.
Open the Tasks List window and click the ![]() icon next to a selected task to open its Task Execution Summary window and display a full list of the task's executions.
icon next to a selected task to open its Task Execution Summary window and display a full list of the task's executions.
Click Show/Hide Columns to open a pop-up window, which displays a list of available fields for each task. Fields in green are displayed by default; click any one of them to remove it from the display.
The following information is displayed for each executed task:
Task_execution_id
Source and target environments
Task Executed By, which the name of the user executing the task.
BE name
Summary statistics about the processed entities, tables, pre-execution processes and post-execution processes.
Execution status, which is set to Completed when all of a task's processes have been completed successfully.
Generating a Task Executions Summary Report
Click![]() next to each executed task to generate and download a summary report. Note that the report displays the task execution overridden parameters, if they exist.
next to each executed task to generate and download a summary report. Note that the report displays the task execution overridden parameters, if they exist.
Click here to download an example of a summary report.
Executions Summary
This is a display of the LUs, pre-execution processes and post-execution processes for the selected task execution. To display the Logical Units Execution Summary, click a task's Task Execution Id setting in the Task Execution Summary window.
Click Show/Hide Columns to open a pop-up window, which displays a list of available fields for each task. Fields in green are displayed by default. Click a field to remove it from the display.
Generating a Task Execution Report on each Process
The execution report displays the following information about the LU execution:
- General information
- Entities list
- Tables list
- Execution errors
- Replaced sequences on Load tasks
To generate and download a Summary Execution Report on an LU, click the ![]() next to each LU.
next to each LU.
Note: The number of entities in the TDM execution report is limited to the number stated in the TDM_SUMMARY_REPORT_LIMIT Global (imported from the TDM library).
Task Execution - Detailed Statistics
Entity-based Task
The Task Execution - Detailed Statistics window displays the following:
- Detailed information on the number of successful and failed entities and tables in a task execution.
- The hierarchical structure of the LUs and their entities.
- A sample list of successful and failed entities.
- Successful and failed entities and tables.
- A search option used for searching an entity.
To display the Task Execution - Detailed Statistics window (shown below), click ![]() in the right corner of the Execution Summary window.
in the right corner of the Execution Summary window.

- The left pane displays the hierarchical tree of the task's LU.
- The right pane displays the number of successful and failed entities and tables and a sample of entities and tables.
By default, the root LU's list of entities and tables is displayed. To view the entities and tables in the Logical Units Hierarchy, click the LU.
The Source ID and Target ID sequences are displayed for each entity ID. When the task replaces the source IDs, the Target ID and Source ID can be different. If an LU in the tree contains failed entities, it is marked in red.
Failed Entities List Tab
An entity is marked as Failed if its process fails or if a child ID fails. For example, a Customer ID is marked as Failed if a copy of a billing subscriber fails. The Failed Entities List tab displays both statuses:
- Entity Status, marked as Failed if the task execution fails to process the entity ID.
- Hierarchy Data Status, marked as Failed if the task execution fails to process a child ID.

View the Hierarchy of a Selected Entity
Click the Source id setting of an entity to view its hierarchy.
Example:
View Customer #10:

Click the Billing LU to view the Subscriber IDs of Customer #10:

Click the child Billing subscriber ID - #37 - to view its hierarchical structure:

Table-based Task
When the user selected the Tables option in the task's Source component, the task is created and runs on tables without entities.
The Task Execution - Detailed Statistics window displays the following:
- Number of successful and failed tables in a task execution.
- List of successful and failed tables.
- Search option used for searching a table.
To display the Task Execution - Detailed Statistics window (shown below), click ![]() in the right corner of the Execution Summary window.
in the right corner of the Execution Summary window.
Successful Tables Tab
The following information is displayed for each successful table:
- Table name
- Number of records
View the below example:

Failed Tables Tab
The following information is displayed for each failed table:
- Table name
- Error message
View the below example:


