Report Layout Design
Overview
Fabric's Reports application provides various controls that enable representation of your data in many different ways. Examples for such controls are:
- Tables - a flexible control that allows grouping, headers and footers, aggregates, sorting, etc. Individual cells can host other controls such as images and more. This report displays tabular data in rows and columns.
- Lists - a free-form layout for a repeating data record.
- Various types of charts, pivot tables and many more tools.
The reports can be created using numerous types of layouts:
- Tabular report is the most straightforward way to visualize your data, in a multicolumn, multirow pattern. A tabular report can group, sort and filter data, based on pre-defined conditions or user input.
- Dashboard is a dashboard-like report that allows combining several different controls, for instance, a chart and a summary table. The page orientation of such report can be defined as Landscape.
- Master-detail report can visualize 2 related data sets.
- And more…
Click here for the list of demos describing various ActiveReportsJS layout features.
Tabular Reports
There are 2 ways for implementing data binding in a tabular report layout:
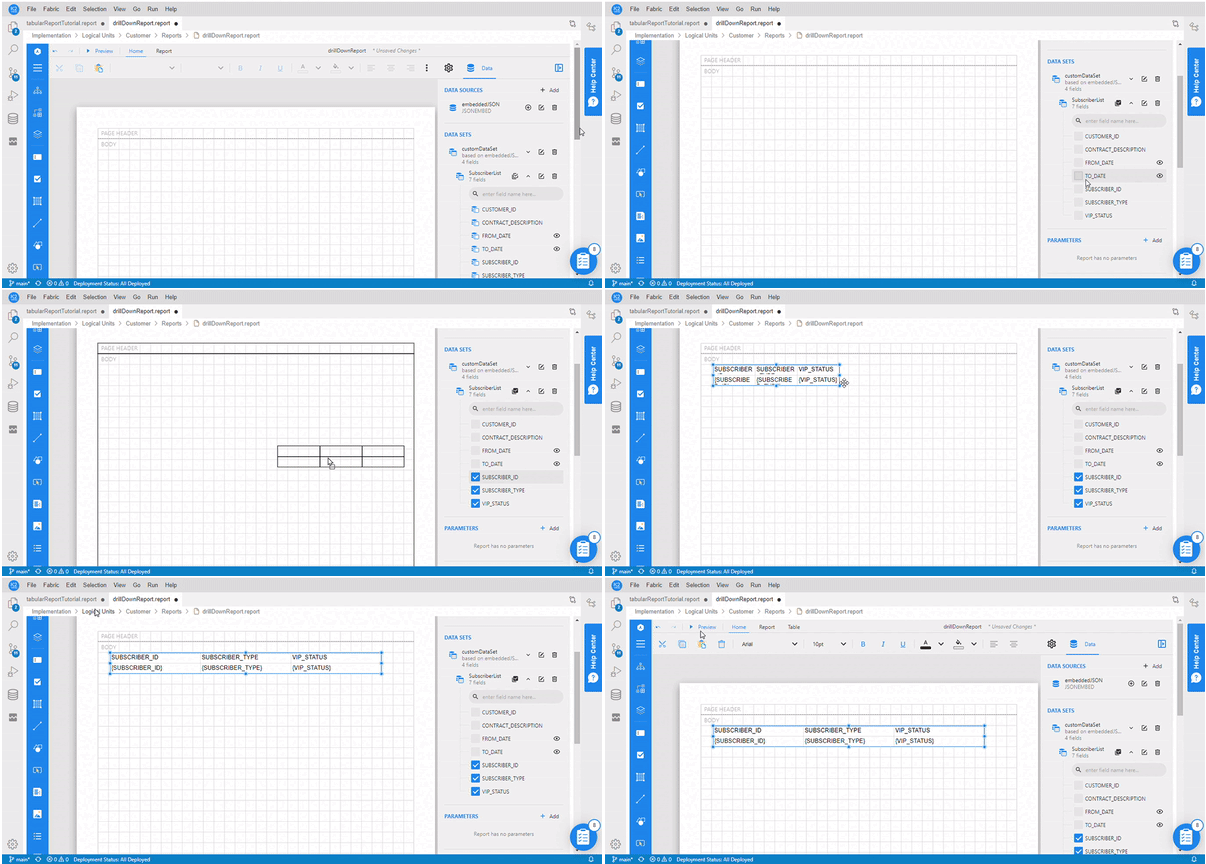
Selecting the data set fields and dragging-and-dropping them into a report page - as in the following display:

Dragging the Table control
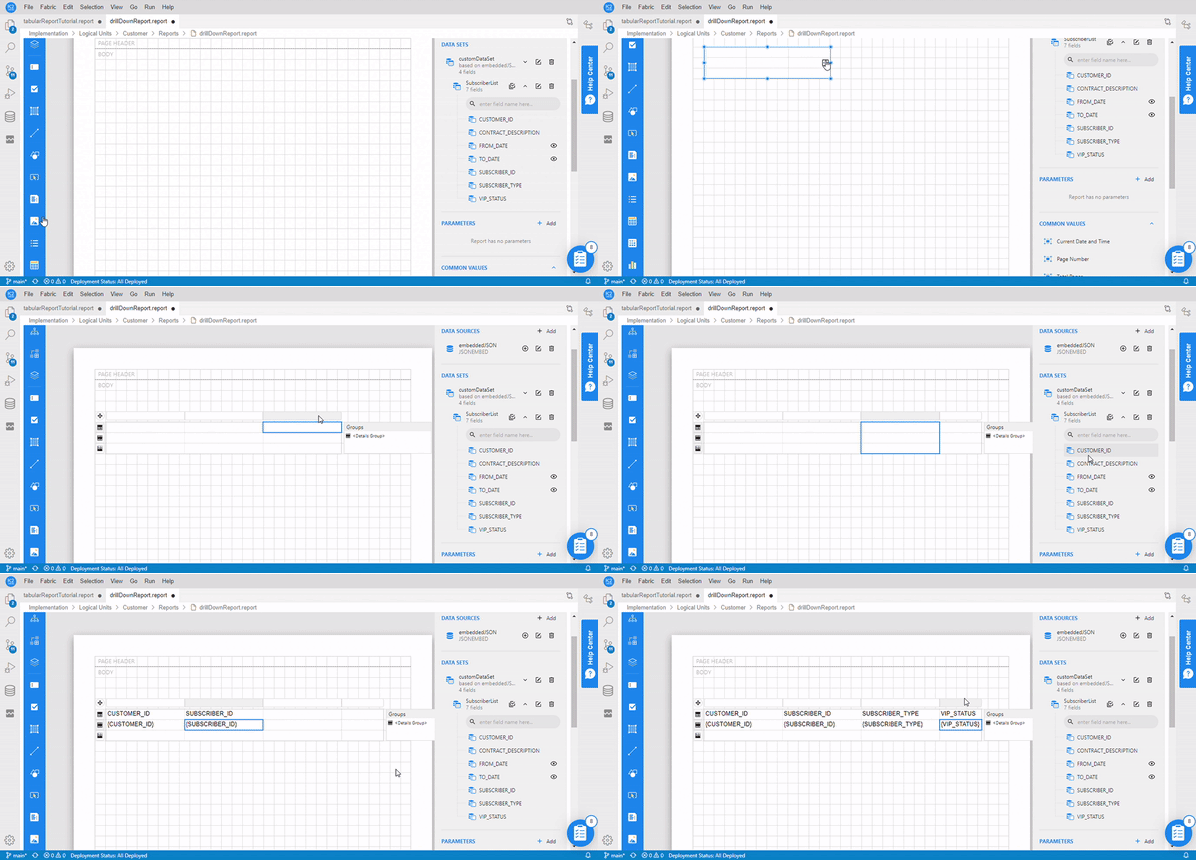
 from the report's toolbox. In this case, you still need to connect the table with its respective data set fields - as in the following display:
The next step should be table formatting, which may include formatting of the cells' font size, color and alignment, for both detail and header rows.
All of the above activities are done on report items, using the Properties panel that is located on the right side of the report designer. Clicking on each report element (cell, column, detail row, header column, table) displays its properties.
You can also create grouping, summarize the data on a group or header/footer level, apply conditional formatting, apply interactive sorting, create bookmarks and jump to them, and more.
Once the table is added to the report page and data binding is in place, you need to click on Preview to see the report layout with the data, following the design.

Example
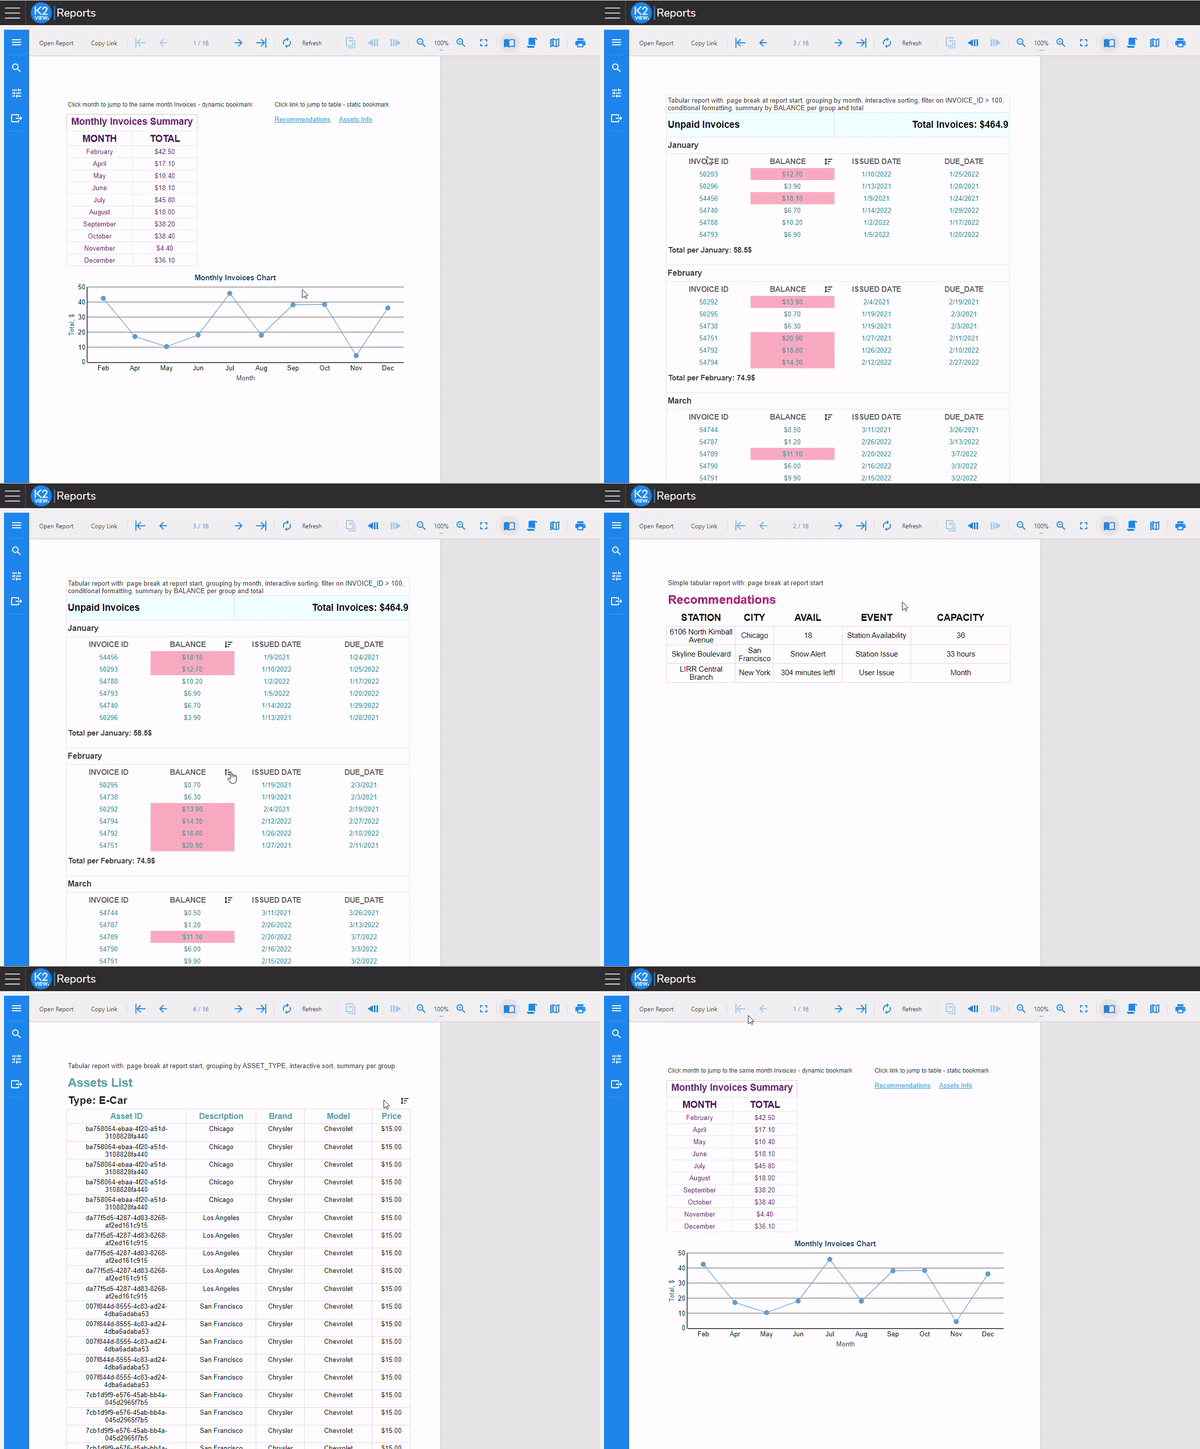
The below example demonstrates several features of a tabular report:

Click here for the full user guide of Tabular report creation.
Report Layout Design
Overview
Fabric's Reports application provides various controls that enable representation of your data in many different ways. Examples for such controls are:
- Tables - a flexible control that allows grouping, headers and footers, aggregates, sorting, etc. Individual cells can host other controls such as images and more. This report displays tabular data in rows and columns.
- Lists - a free-form layout for a repeating data record.
- Various types of charts, pivot tables and many more tools.
The reports can be created using numerous types of layouts:
- Tabular report is the most straightforward way to visualize your data, in a multicolumn, multirow pattern. A tabular report can group, sort and filter data, based on pre-defined conditions or user input.
- Dashboard is a dashboard-like report that allows combining several different controls, for instance, a chart and a summary table. The page orientation of such report can be defined as Landscape.
- Master-detail report can visualize 2 related data sets.
- And more…
Click here for the list of demos describing various ActiveReportsJS layout features.
Tabular Reports
There are 2 ways for implementing data binding in a tabular report layout:
Selecting the data set fields and dragging-and-dropping them into a report page - as in the following display:

Dragging the Table control
 from the report's toolbox. In this case, you still need to connect the table with its respective data set fields - as in the following display:
The next step should be table formatting, which may include formatting of the cells' font size, color and alignment, for both detail and header rows.
All of the above activities are done on report items, using the Properties panel that is located on the right side of the report designer. Clicking on each report element (cell, column, detail row, header column, table) displays its properties.
You can also create grouping, summarize the data on a group or header/footer level, apply conditional formatting, apply interactive sorting, create bookmarks and jump to them, and more.
Once the table is added to the report page and data binding is in place, you need to click on Preview to see the report layout with the data, following the design.

Example
The below example demonstrates several features of a tabular report:

Click here for the full user guide of Tabular report creation.


