Monitoring and Logs
Overview
K2cloud SaaS provides built-in monitoring capabilities for deployed Spaces.
Because K2view operates the underlying infrastructure for SaaS customers, K2cloud provides operational visibility directly through the Space experience, including:
- runtime activity metrics,
- API activity,
- mDB reads and writes,
- errors,
- runtime logs,
- and audit entries when audit logging is enabled.
These monitoring capabilities are specific to K2cloud SaaS.
K2cloud Self-Hosted customers operate their own infrastructure and use their own observability framework for monitoring, log collection, alerting, audit export, and SIEM integration.
Space Activity
For K2cloud SaaS Spaces, the Space card provides a high-level view of runtime activity.
Depending on the Space, this can include information such as:
- API calls,
- errors,
- mDB reads,
- mDB writes,
- status change,
- and last deployment.
This provides an immediate operational view without requiring access to the underlying Kubernetes infrastructure.
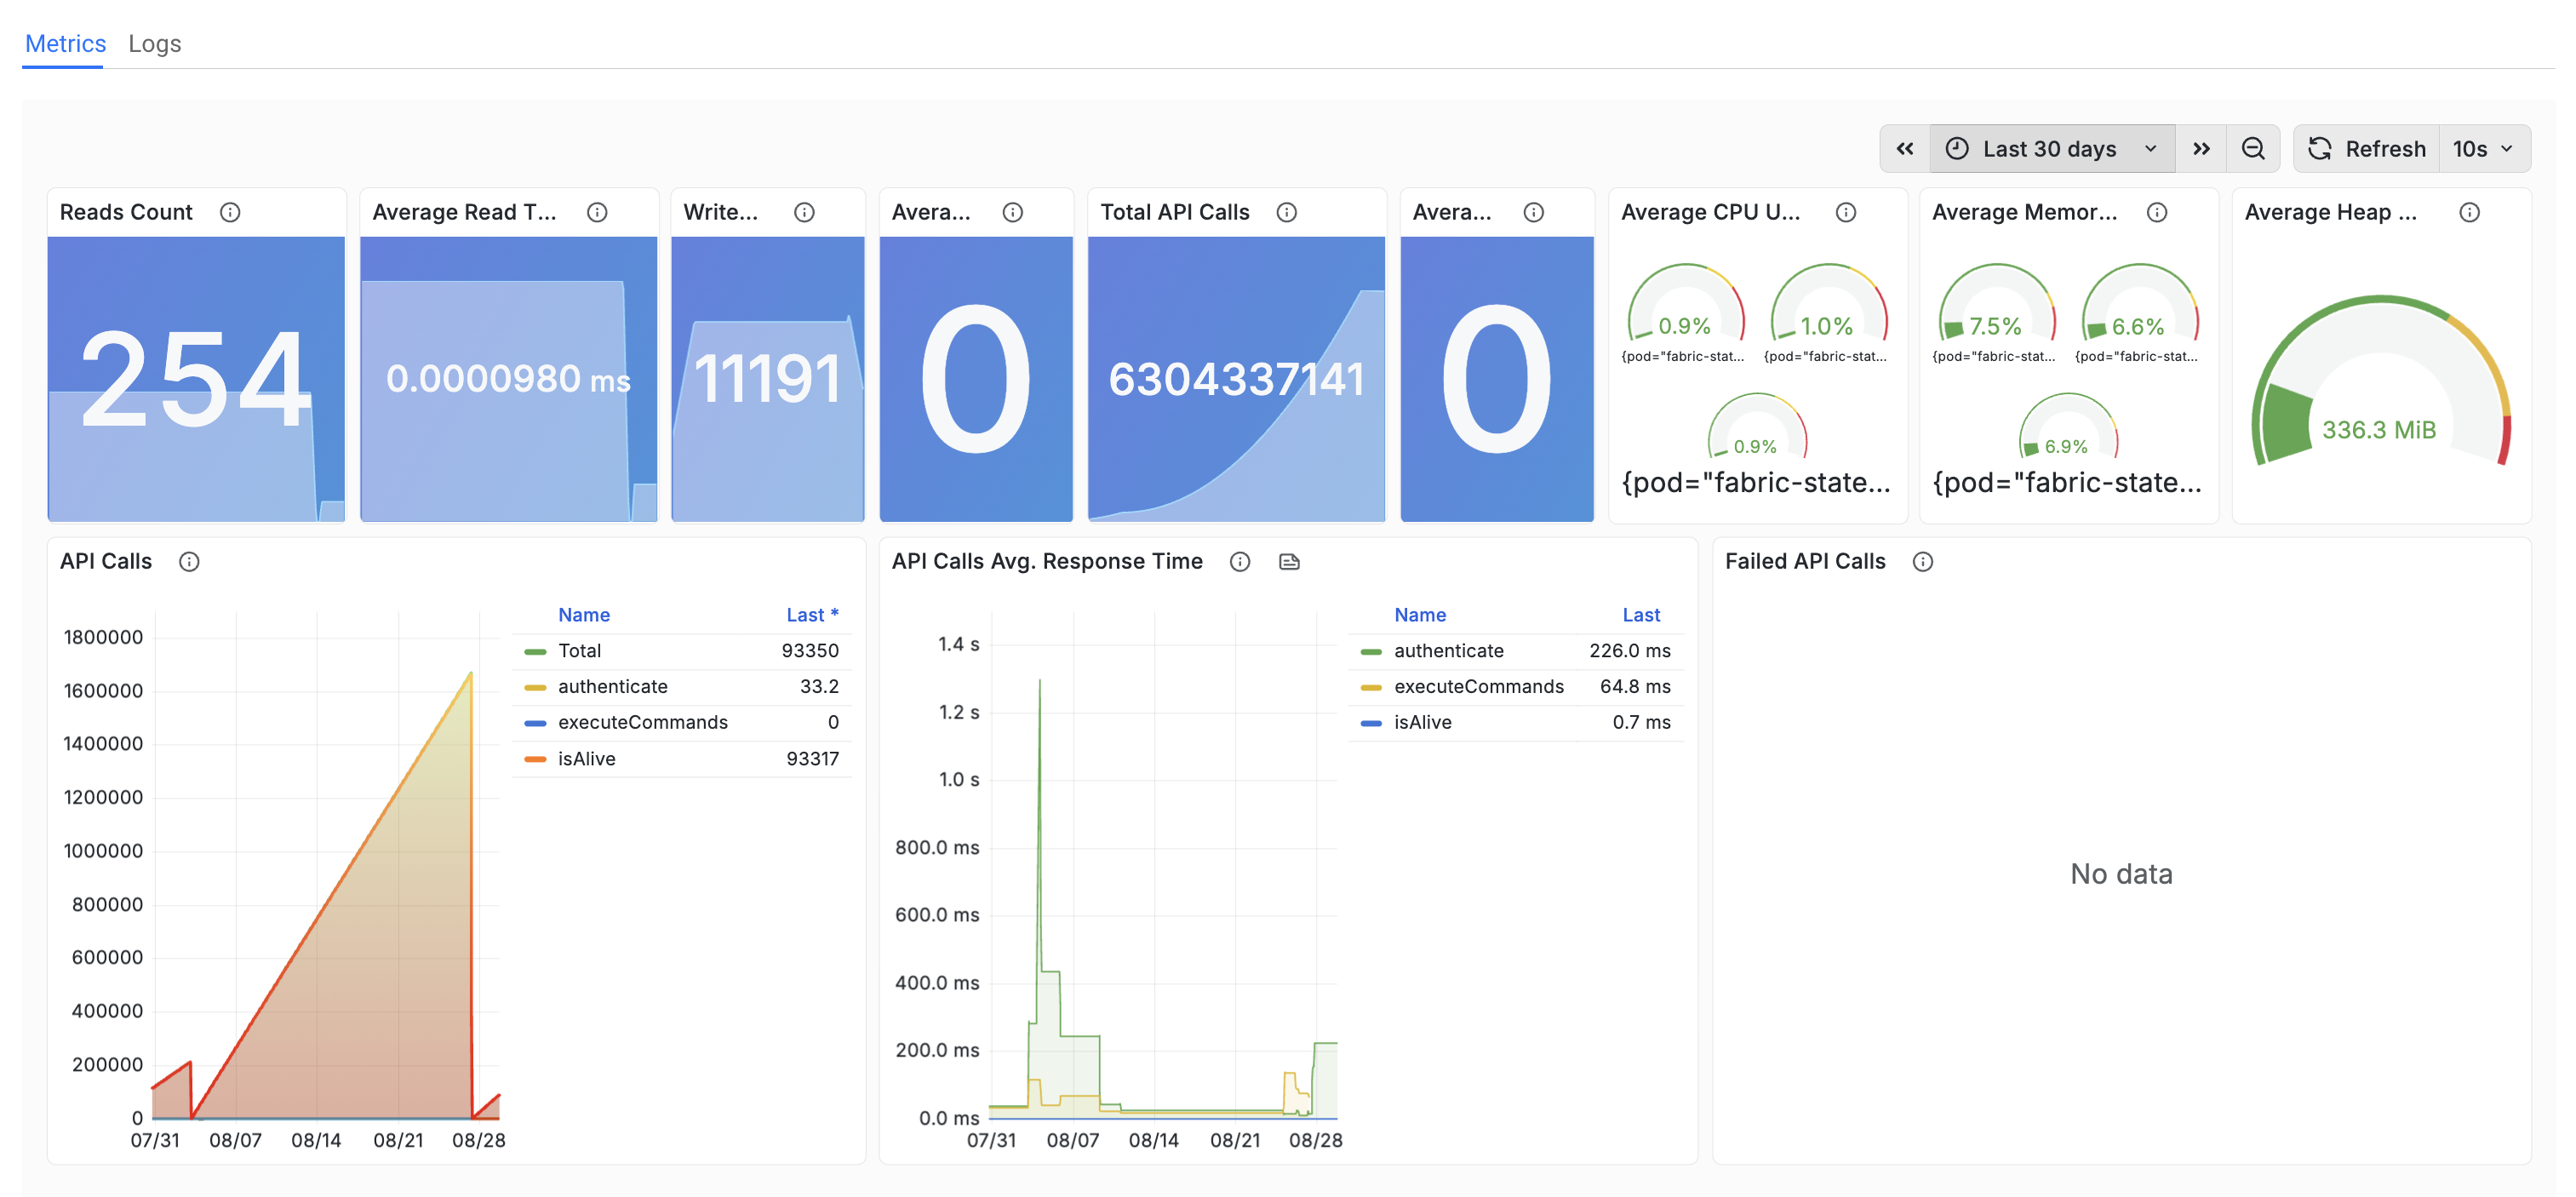
Metrics
The Metrics tab provides an activity dashboard for the Space.
Use the dashboard to review runtime activity over time and understand the workload being processed by the Space.
The metrics available depend on the activity of the runtime environment.
Logs
The Logs tab provides access to runtime logs.
Common log levels include:
- INFO,
- DEBUG,
- WARNING,
- ERROR,
- AUDIT.
AUDIT entries are available when audit logging is enabled.
The Logs view provides application-level operational information for the SaaS Space and is separate from the Kubernetes pod logs available through Space Details.
Monitoring Versus Space Details
K2cloud monitoring and Space Details serve different purposes.
Monitoring and Logs provide application and workload visibility for K2cloud SaaS Spaces.
Space Details provides Kubernetes-level deployment diagnostics such as:
- pod state and readiness,
- restart counts,
- CPU and memory information,
- Kubernetes container logs,
- Kubernetes Events,
- and raw pod definitions.
For Kubernetes-level diagnostics, see View Space Details.
Self-Hosted Observability
The K2cloud SaaS monitoring components described in this article are not provided for K2cloud Self-Hosted environments.
Self-Hosted customers use the monitoring and observability capabilities established for their own infrastructure. This typically includes their organization's:
- infrastructure monitoring,
- log collection,
- alerting,
- audit handling,
- and SIEM integration.
K2cloud continues to provide orchestration and lifecycle management of the Fabric Spaces, while infrastructure observability remains within the customer's operational environment.
Related Documentation
Monitoring and Logs
Overview
K2cloud SaaS provides built-in monitoring capabilities for deployed Spaces.
Because K2view operates the underlying infrastructure for SaaS customers, K2cloud provides operational visibility directly through the Space experience, including:
- runtime activity metrics,
- API activity,
- mDB reads and writes,
- errors,
- runtime logs,
- and audit entries when audit logging is enabled.
These monitoring capabilities are specific to K2cloud SaaS.
K2cloud Self-Hosted customers operate their own infrastructure and use their own observability framework for monitoring, log collection, alerting, audit export, and SIEM integration.
Space Activity
For K2cloud SaaS Spaces, the Space card provides a high-level view of runtime activity.
Depending on the Space, this can include information such as:
- API calls,
- errors,
- mDB reads,
- mDB writes,
- status change,
- and last deployment.
This provides an immediate operational view without requiring access to the underlying Kubernetes infrastructure.
Metrics
The Metrics tab provides an activity dashboard for the Space.
Use the dashboard to review runtime activity over time and understand the workload being processed by the Space.
The metrics available depend on the activity of the runtime environment.
Logs
The Logs tab provides access to runtime logs.
Common log levels include:
- INFO,
- DEBUG,
- WARNING,
- ERROR,
- AUDIT.
AUDIT entries are available when audit logging is enabled.
The Logs view provides application-level operational information for the SaaS Space and is separate from the Kubernetes pod logs available through Space Details.
Monitoring Versus Space Details
K2cloud monitoring and Space Details serve different purposes.
Monitoring and Logs provide application and workload visibility for K2cloud SaaS Spaces.
Space Details provides Kubernetes-level deployment diagnostics such as:
- pod state and readiness,
- restart counts,
- CPU and memory information,
- Kubernetes container logs,
- Kubernetes Events,
- and raw pod definitions.
For Kubernetes-level diagnostics, see View Space Details.
Self-Hosted Observability
The K2cloud SaaS monitoring components described in this article are not provided for K2cloud Self-Hosted environments.
Self-Hosted customers use the monitoring and observability capabilities established for their own infrastructure. This typically includes their organization's:
- infrastructure monitoring,
- log collection,
- alerting,
- audit handling,
- and SIEM integration.
K2cloud continues to provide orchestration and lifecycle management of the Fabric Spaces, while infrastructure observability remains within the customer's operational environment.
Related Documentation