
×
![]()

Dashboard Graphs
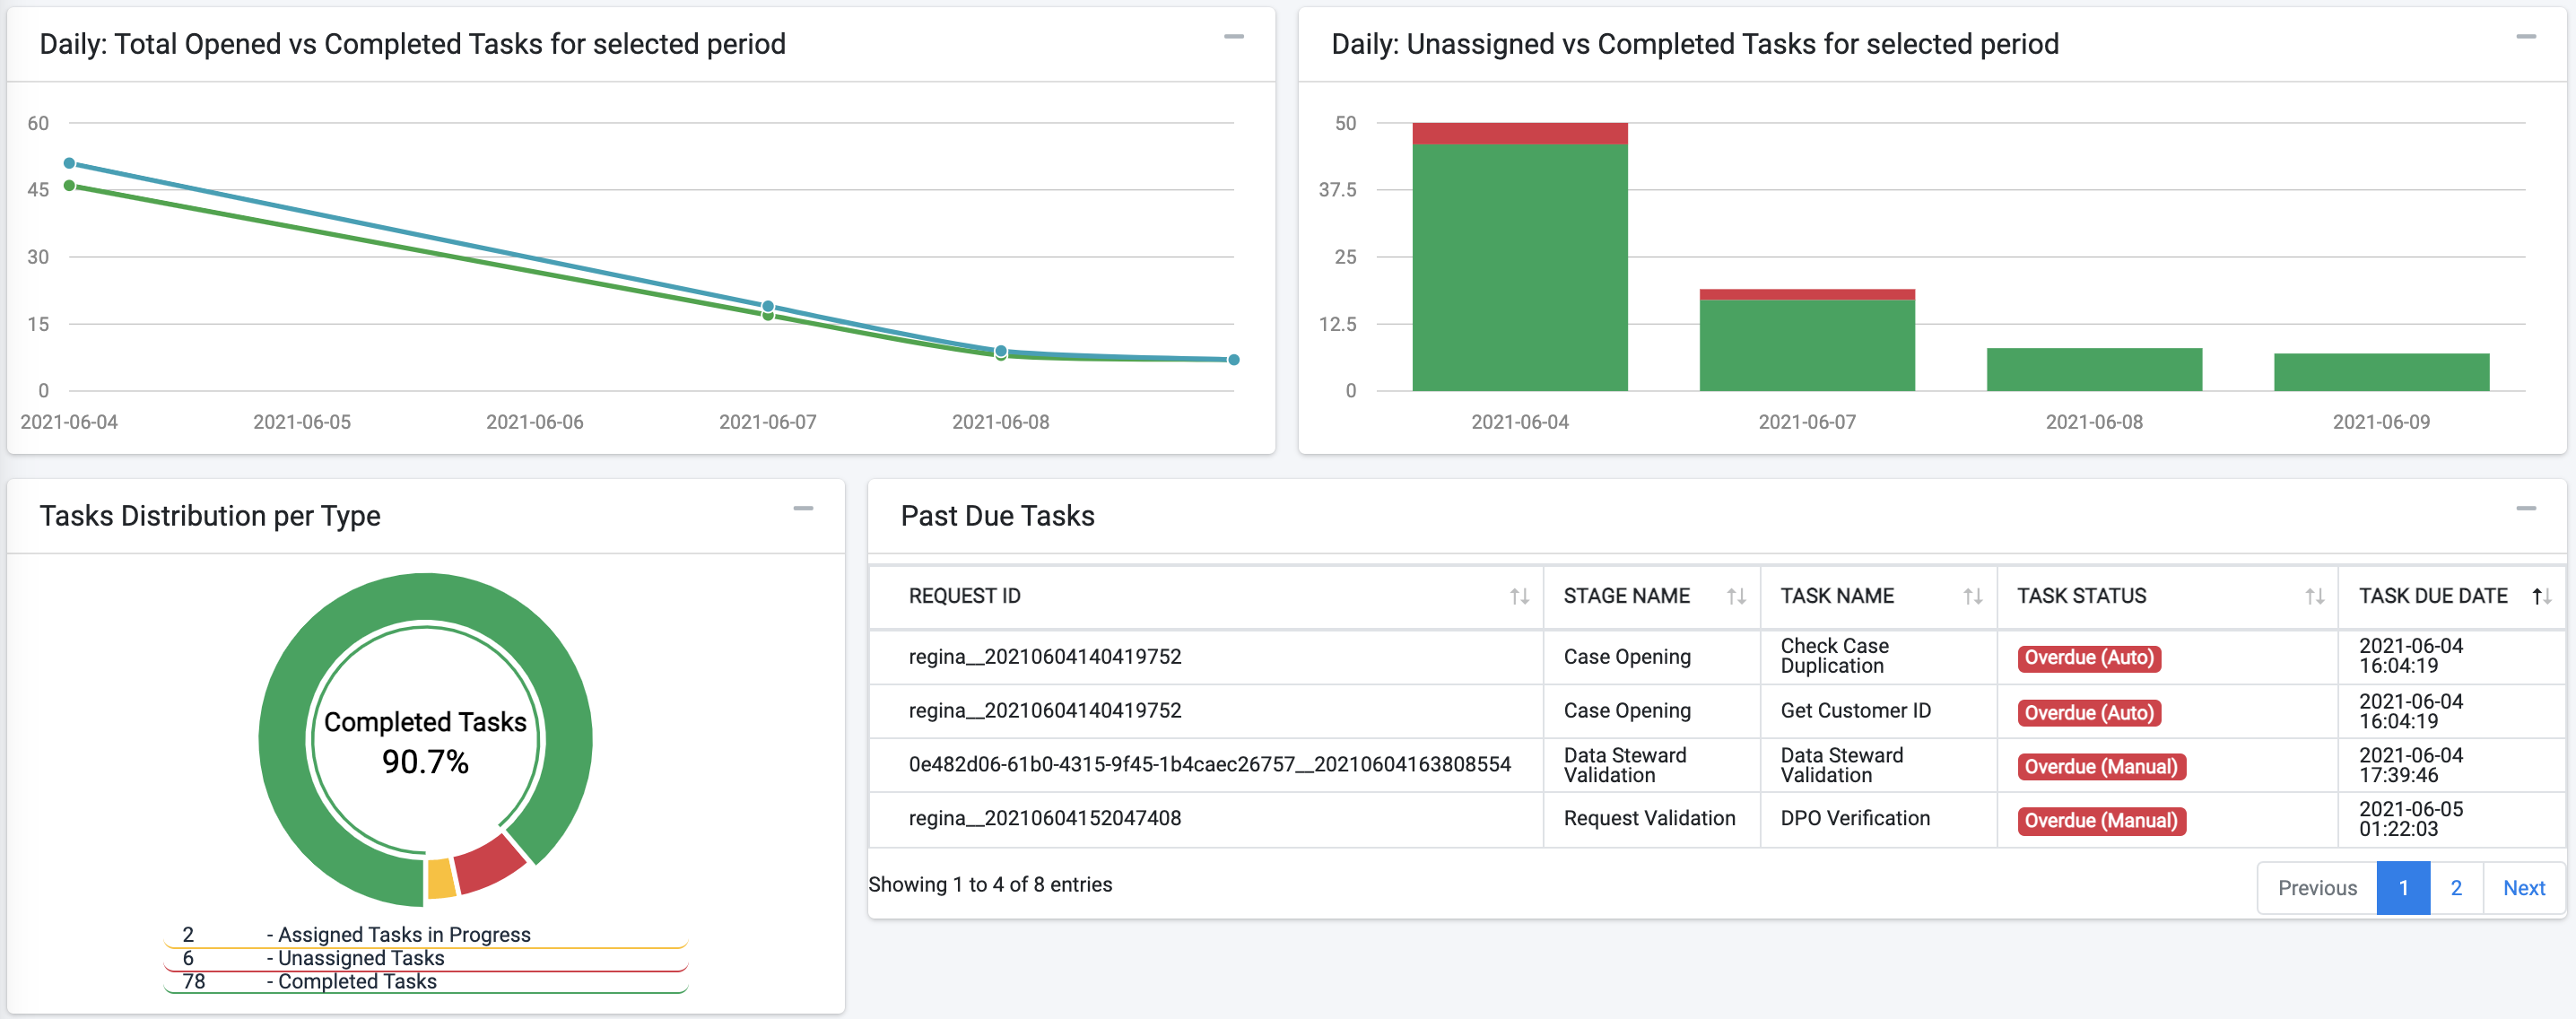
- Daily: Total Opened Vs. Completed Tasks for selected period – This graph compares, for the filter conditions, the number of the Tasks opened in any given day of the selected date range, with the number of Tasks closed in the same period.
- Daily: Total Unassigned Vs. Completed Tasks for selected period – This graph compares, for the filter conditions, the number of unassigned Tasks opened in any given day of the selected date range, with the number of Tasks closed in the same period.
- Open Requests per Selected Date Range – this graph shows the distribution of the open requests according to the request submission date. The graph indicates the number of open Requests, as well as how many of those requests have at least one overdue Task.


Dashboard Graphs
- Daily: Total Opened Vs. Completed Tasks for selected period – This graph compares, for the filter conditions, the number of the Tasks opened in any given day of the selected date range, with the number of Tasks closed in the same period.
- Daily: Total Unassigned Vs. Completed Tasks for selected period – This graph compares, for the filter conditions, the number of unassigned Tasks opened in any given day of the selected date range, with the number of Tasks closed in the same period.
- Open Requests per Selected Date Range – this graph shows the distribution of the open requests according to the request submission date. The graph indicates the number of open Requests, as well as how many of those requests have at least one overdue Task.

© Copyright 2025 K2VIEW