

Debugging with IntelliJ
There are a range of key-features offered by IntelliJ IDE that lets you accelerate your implementation. In this article, we will focus on Fabric Java project debugging capabilities.
Debugging
Refer to the following links to set up a simple Java debugging scheme on your project:
Step-through Debugging Example
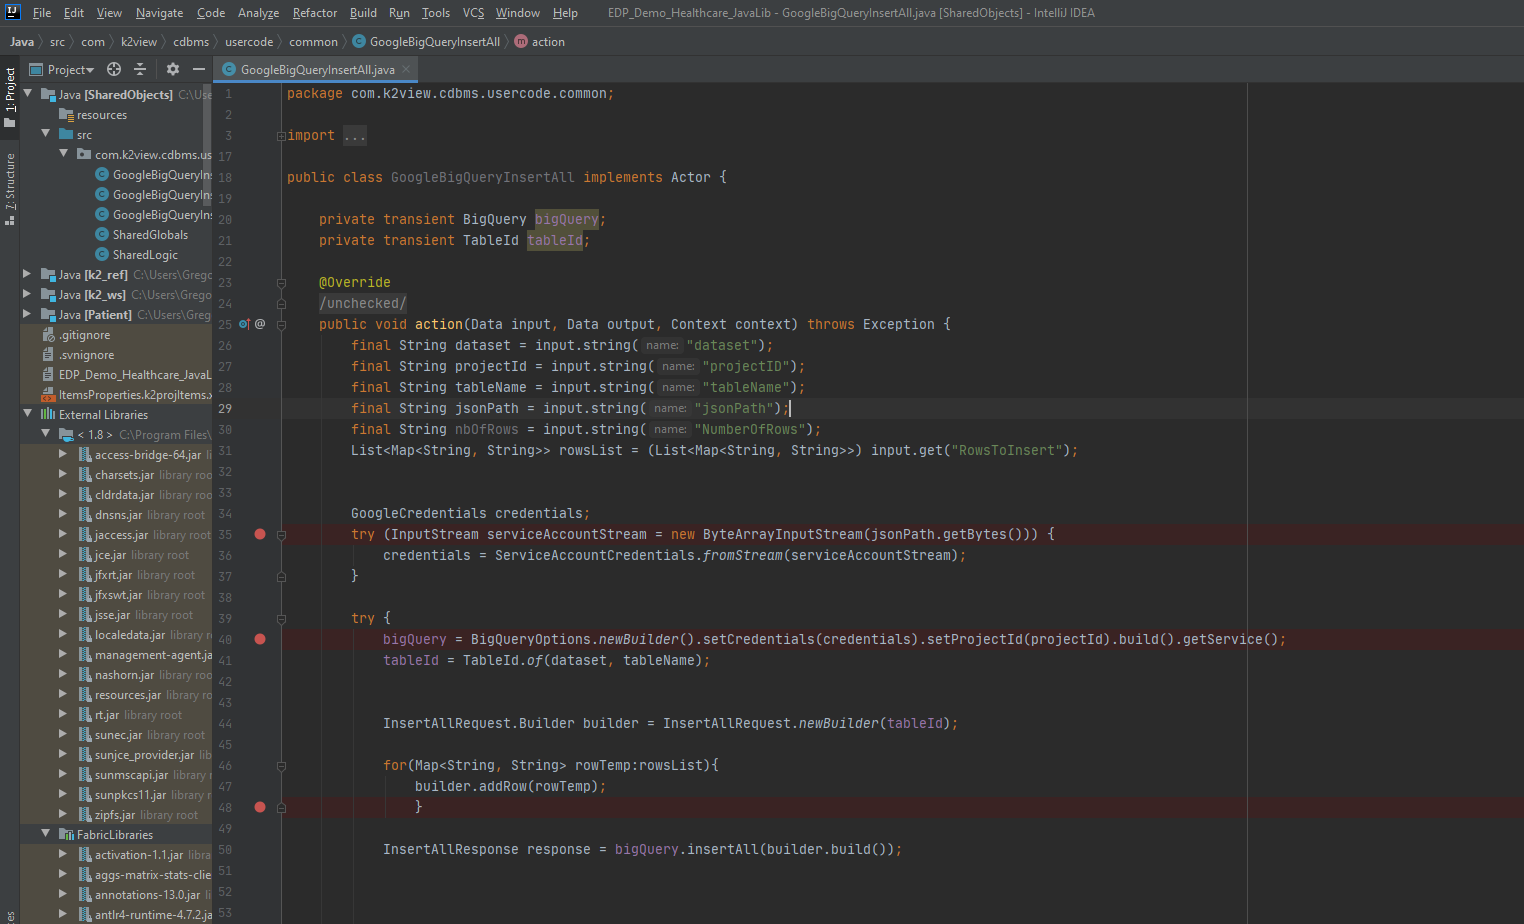
Open the Java file you wish to debug in IntelliJ.
Select the lines on which to add the breakpoints - see the red bullets below next to the line numbers.
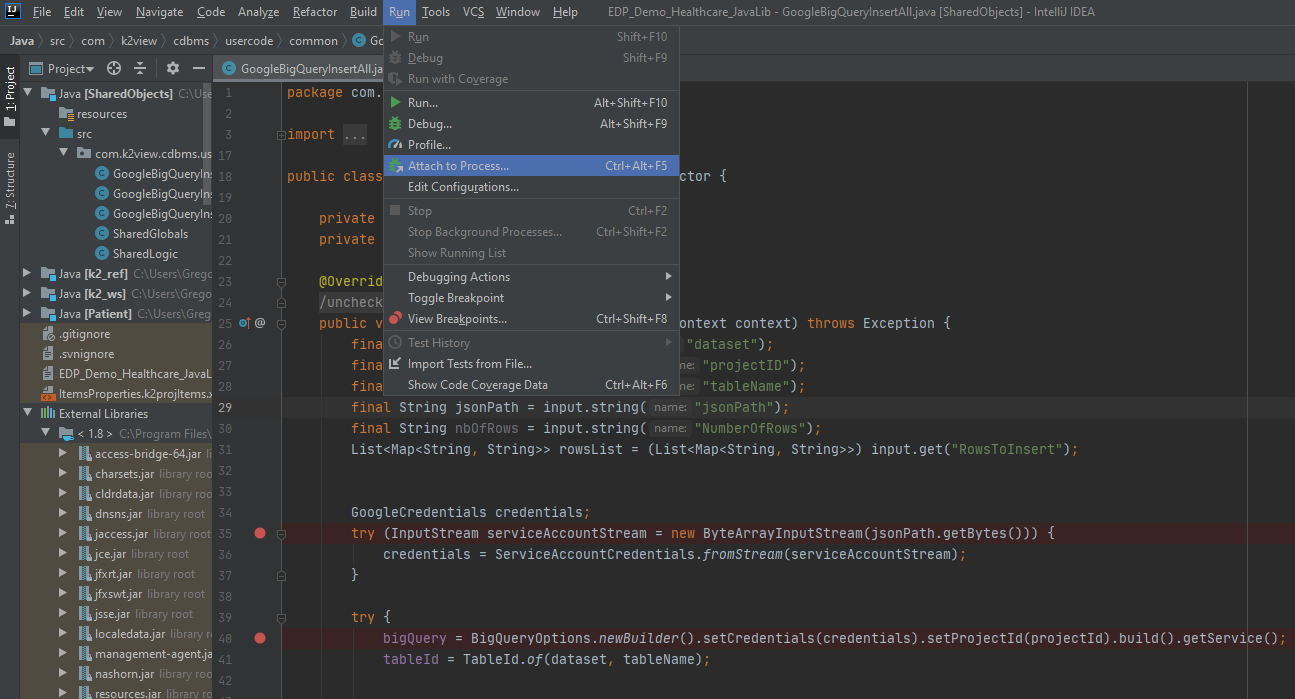
Select the Run -> Attach to Process option from the menu bar.
Select the process to which to attach the Java debugger - for example in the screenshot displayed below, the
26972 com.k2view.fabric.boot.Boot (5009)option is selected.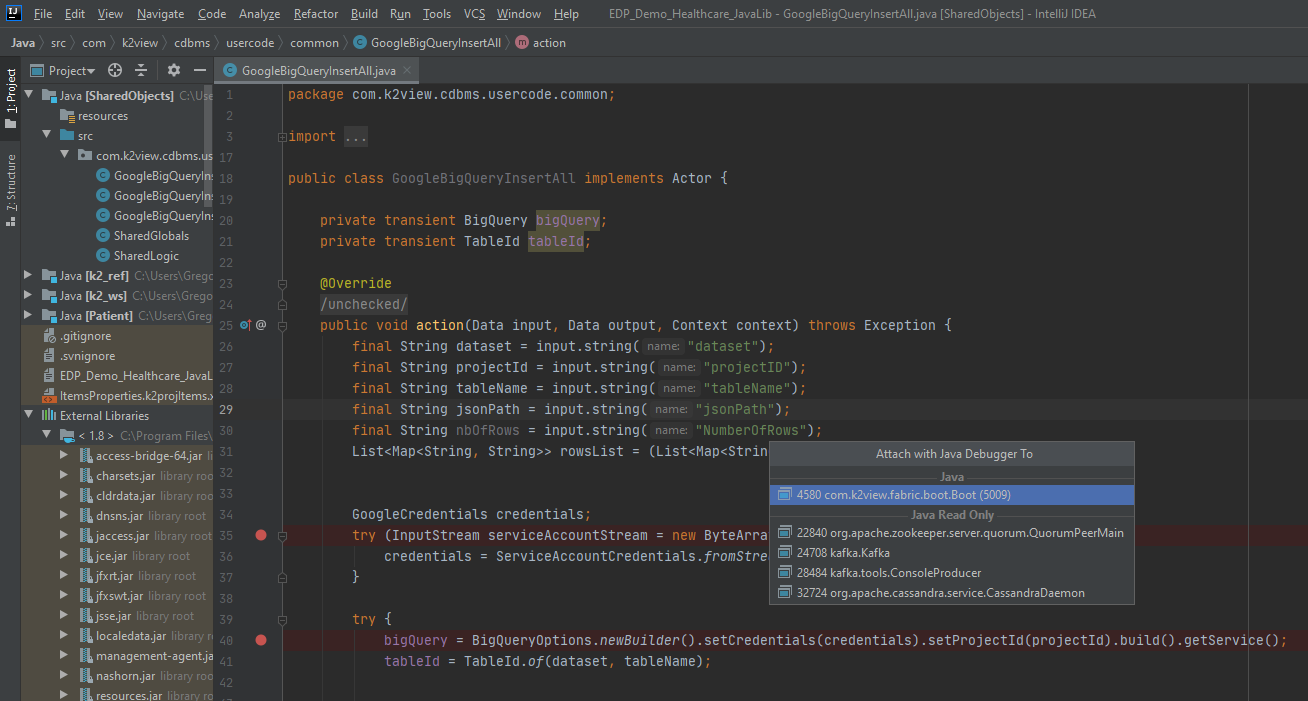
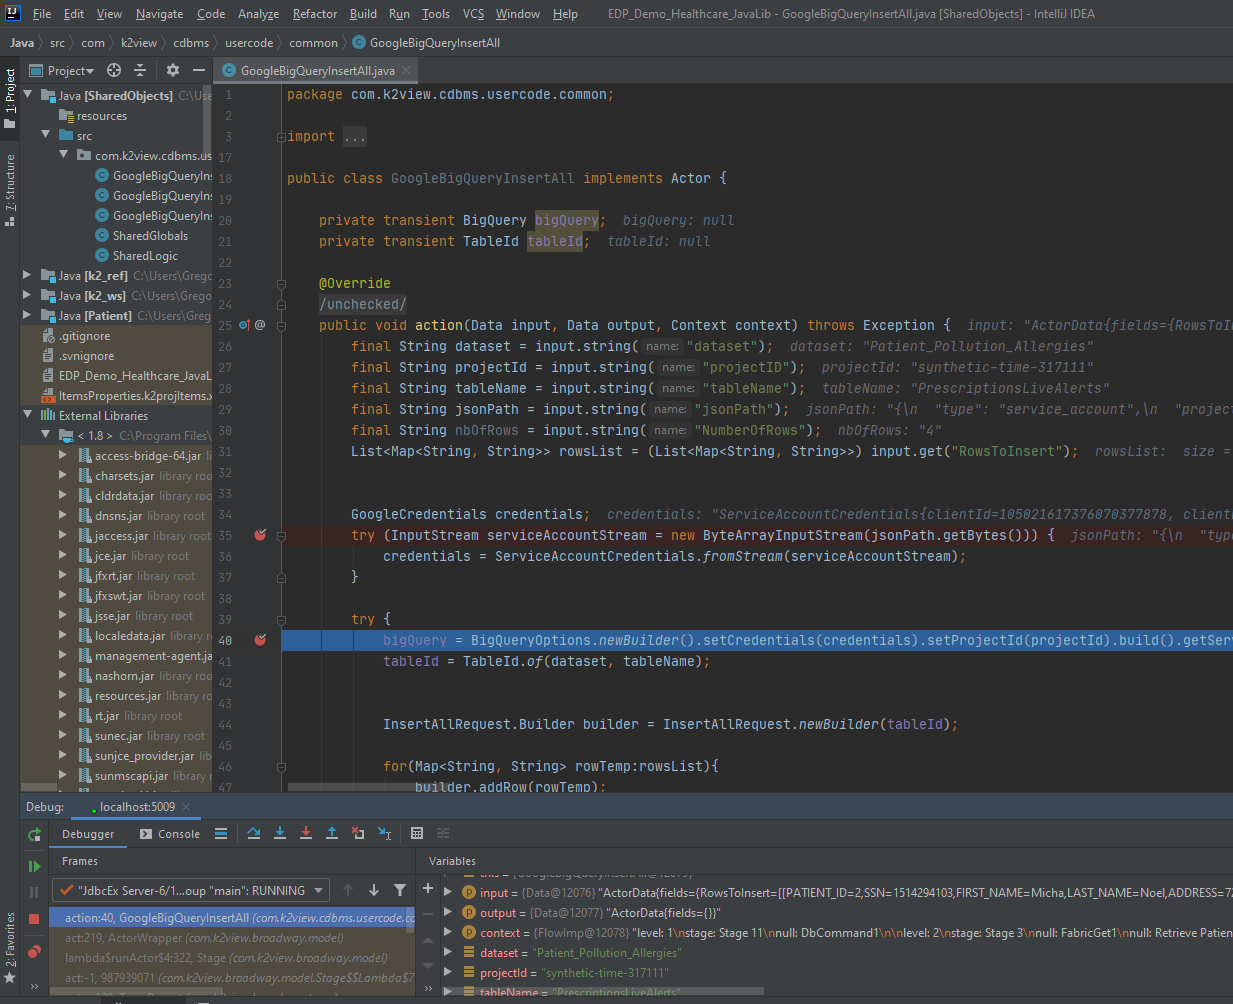
Run your code and step through the program’s breakpoints using the controls on the left hand-side of the debug window

Debugging with IntelliJ
There are a range of key-features offered by IntelliJ IDE that lets you accelerate your implementation. In this article, we will focus on Fabric Java project debugging capabilities.
Debugging
Refer to the following links to set up a simple Java debugging scheme on your project:
Step-through Debugging Example
Open the Java file you wish to debug in IntelliJ.
Select the lines on which to add the breakpoints - see the red bullets below next to the line numbers.
Select the Run -> Attach to Process option from the menu bar.
Select the process to which to attach the Java debugger - for example in the screenshot displayed below, the
26972 com.k2view.fabric.boot.Boot (5009)option is selected.Run your code and step through the program’s breakpoints using the controls on the left hand-side of the debug window
