Table Population Diagram Outline
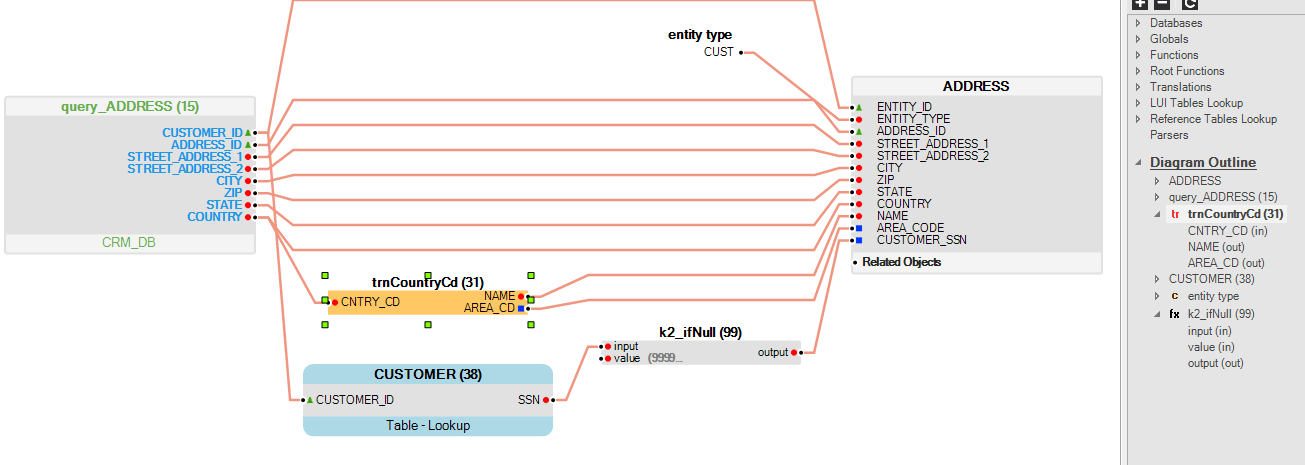
The Diagram Outline of the population map is located in the Objects tab of the Table Population window and displays all objects that are currently found in the population map. When clicking the object’s name, or object’s column name in the Diagram Outline, the matching object or column is marked in the Table Population working area. For example, the following diagram outline displays a list of objects included in the table population:

When an object or a field of an object is selected in the Diagram Outline, it is also highlighted in the map. For example, in the above diagram the Translation object trnCountryCd is selected in the Diagram and it is highlighted in the map.
Table Population Diagram Outline
The Diagram Outline of the population map is located in the Objects tab of the Table Population window and displays all objects that are currently found in the population map. When clicking the object’s name, or object’s column name in the Diagram Outline, the matching object or column is marked in the Table Population working area. For example, the following diagram outline displays a list of objects included in the table population:

When an object or a field of an object is selected in the Diagram Outline, it is also highlighted in the map. For example, in the above diagram the Translation object trnCountryCd is selected in the Diagram and it is highlighted in the map.


