Table Population Overview
What Is a Table Population?
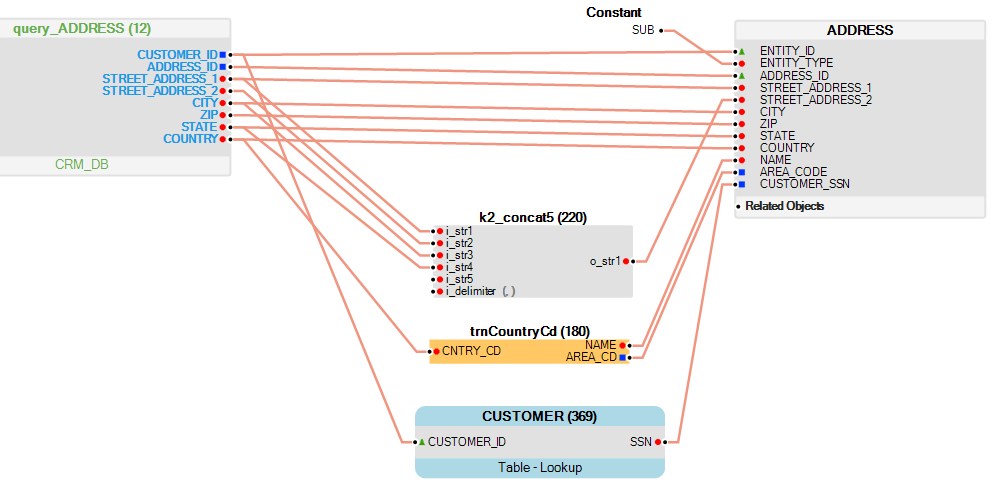
A Table Population defines and executes mapping and data transformation rules from a data source, like a DB table or Input file, into a target Logical Unit (LU) table. The population acts as a map that renders a graphical display of the transformation’s business logic from the source object to the target LU table. Source data can be mapped directly to LU table columns and Fabric transformation objects like Translations, Functions or Globals, and can be added to define the mapping logic into the LU table.
Each table can have one or several table populations that can be executed simultaneously or according to a predefined execution order. Each table population extracts data from a data source, transforms it when needed and then populates the data into an LU table. Table populations can be categorized as follows:
- Based on a source object:
- DB query, (default) that executes an SQL Select query on a predefined DB interface.
- Root function, that can run various SQL Select queries and execute complex logic using Java code, including data manipulations, Fabric APIs, Fabric commands and calculations. All records yielded from the function are inserted into the table. Note that tables can also be populated or updated by Enrichment functions which, unlike Root functions, are executed after all LU tables are populated.
Based on a Broadway flow, whereby a Broadway Flow template is created to extract the data from the source and populate it into the target LU table. A Broadway Flow template can be enhanced with additional logic pre and post loading.
Click for more information about Table Population based on a Broadway flow.
Table Population In an LU Schema
An LU Schema displays a hierarchical representation of the data related to the Root Table. Parent-child links in LU tables are created via their Table Population objects:
- Each LU table can have one or several Table Population objects.
- Each Table Population object, apart from the Table Population of the LU's Root Table, must be linked to a parent table via its Input columns.
- Each Table Population object can be linked to a different parent LU table. Note that an LU table can be added to an LU Schema without a Table Population object. This table is not populated by the sync process of the LU Instance but can be populated by a separate transaction.
Click for more information about Building an LU Hierarchy and Linking Table Populations.
Table Population Window
The Table Population window is used to define and display the transformation rules that are applied to data when it is loaded into a Fabric database.
Click for more information about How to Create a New Population.
The following is an example of the Table Population window.

The Table Population window has the following sections:
Population Window Header
The Population window header holds the Debug and Options toolbars where additional toolbars like Edit, Zoom, Alignment or Export can be added when needed.
Click for more information about Additional Toolbars.
Debug Toolbar
The Debug toolbar holds options for testing the Population process by executing its logic on a selected Instance ID.
- When the execution is successful, the values of the Input and Output fields are displayed in the working area above the connection lines between the source and the target.
- If there is an error, it is displayed in the Fabric Studio Log section.
- If the outcome has more than one row, you can navigate between the different rows.
Click for more information about Debugging the Table Population.
Options Toolbar
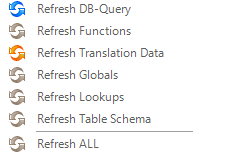
The Options toolbar includes Refresh and Group / Ungroup options.
Population Window Working Area
The Table Population Working Area acts as a workspace for mapping the Source Object to the target LU table. Transformation objects can also be added to the working area map.
The Working Area includes:
Click for more information about Table Population Transformation Rules.
Properties Tab
The Properties Tab in a Table Population window (right pane) displays the properties of each selected object in the Table Population object. For example, source table, target LU table or a translation. Note that some properties are editable.
Click for more information about the Table Population Properties Tab.
Objects Tab
The Objects Tab in a Table Population window (right pane) displays all available Fabric objects. For example, Databases, Globals, Built-In Functions or Project Functions. Objects can be included in a population map by dragging and dropping them into the working area.
Click for more information about Table Population Transformation Rules.
Diagram Outline Link
The Expand / Collapse and Refresh links are displayed above the Objects tab.
|
Expand all. |
|
|
Collapse all. |
|
|
Refresh Tree, refreshes the Objects tree. If a new object is created after the Population window is opened, click Refresh Tree to display the object in the tree. |
Click for more information about the Table Population Diagram Outline.
Table Population Overview
What Is a Table Population?
A Table Population defines and executes mapping and data transformation rules from a data source, like a DB table or Input file, into a target Logical Unit (LU) table. The population acts as a map that renders a graphical display of the transformation’s business logic from the source object to the target LU table. Source data can be mapped directly to LU table columns and Fabric transformation objects like Translations, Functions or Globals, and can be added to define the mapping logic into the LU table.
Each table can have one or several table populations that can be executed simultaneously or according to a predefined execution order. Each table population extracts data from a data source, transforms it when needed and then populates the data into an LU table. Table populations can be categorized as follows:
- Based on a source object:
- DB query, (default) that executes an SQL Select query on a predefined DB interface.
- Root function, that can run various SQL Select queries and execute complex logic using Java code, including data manipulations, Fabric APIs, Fabric commands and calculations. All records yielded from the function are inserted into the table. Note that tables can also be populated or updated by Enrichment functions which, unlike Root functions, are executed after all LU tables are populated.
Based on a Broadway flow, whereby a Broadway Flow template is created to extract the data from the source and populate it into the target LU table. A Broadway Flow template can be enhanced with additional logic pre and post loading.
Click for more information about Table Population based on a Broadway flow.
Table Population In an LU Schema
An LU Schema displays a hierarchical representation of the data related to the Root Table. Parent-child links in LU tables are created via their Table Population objects:
- Each LU table can have one or several Table Population objects.
- Each Table Population object, apart from the Table Population of the LU's Root Table, must be linked to a parent table via its Input columns.
- Each Table Population object can be linked to a different parent LU table. Note that an LU table can be added to an LU Schema without a Table Population object. This table is not populated by the sync process of the LU Instance but can be populated by a separate transaction.
Click for more information about Building an LU Hierarchy and Linking Table Populations.
Table Population Window
The Table Population window is used to define and display the transformation rules that are applied to data when it is loaded into a Fabric database.
Click for more information about How to Create a New Population.
The following is an example of the Table Population window.

The Table Population window has the following sections:
Population Window Header
The Population window header holds the Debug and Options toolbars where additional toolbars like Edit, Zoom, Alignment or Export can be added when needed.
Click for more information about Additional Toolbars.
Debug Toolbar
The Debug toolbar holds options for testing the Population process by executing its logic on a selected Instance ID.
- When the execution is successful, the values of the Input and Output fields are displayed in the working area above the connection lines between the source and the target.
- If there is an error, it is displayed in the Fabric Studio Log section.
- If the outcome has more than one row, you can navigate between the different rows.
Click for more information about Debugging the Table Population.
Options Toolbar
The Options toolbar includes Refresh and Group / Ungroup options.
Population Window Working Area
The Table Population Working Area acts as a workspace for mapping the Source Object to the target LU table. Transformation objects can also be added to the working area map.
The Working Area includes:
Click for more information about Table Population Transformation Rules.
Properties Tab
The Properties Tab in a Table Population window (right pane) displays the properties of each selected object in the Table Population object. For example, source table, target LU table or a translation. Note that some properties are editable.
Click for more information about the Table Population Properties Tab.
Objects Tab
The Objects Tab in a Table Population window (right pane) displays all available Fabric objects. For example, Databases, Globals, Built-In Functions or Project Functions. Objects can be included in a population map by dragging and dropping them into the working area.
Click for more information about Table Population Transformation Rules.
Diagram Outline Link
The Expand / Collapse and Refresh links are displayed above the Objects tab.
|
Expand all. |
|
|
Collapse all. |
|
|
Refresh Tree, refreshes the Objects tree. If a new object is created after the Population window is opened, click Refresh Tree to display the object in the tree. |
Click for more information about the Table Population Diagram Outline.


