


Data Viewer
The Data Viewer enables you to view a Logical Unit Instance database (MicroDB) tables' content, which is useful for testing and defect resolutions. As an LUI is associated to an LU, the viewing of its data is accessible from the LU context within the Studio.
How Do I View Data in a Logical Unit?
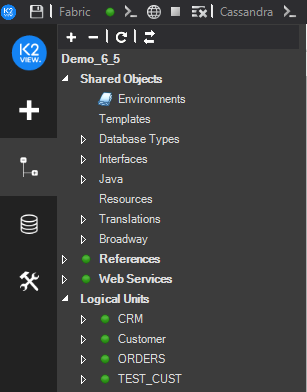
Go to the Project Tree, click Logical Units and verify that the LU has a green icon, indicating that it is deployed to the debug server. If the LU has a white icon, deploy it to the debug server before running the Data Viewer on it. Do either:
- Right-click the LU > Deploy To debug.
- Click the Deploy icon, located at the top of Fabric's Debug Panel.
Click on
 next to the selected LU to open the Data Viewer window.
Set the Sync Mode in the top left pane; the default Sync Mode is ON.
In the Instance ID field (top central pane) - enter an Instance ID (IID).
Click
 Play to generate a new Data Viewer file.
Fabric runs the GET LUI command on the debug server of the selected Instance ID. Each sync of an LUI creates a new *.db SQLite file for the LU instance. The LU Instance is displayed in the Instances Tree.
Play to generate a new Data Viewer file.
Fabric runs the GET LUI command on the debug server of the selected Instance ID. Each sync of an LUI creates a new *.db SQLite file for the LU instance. The LU Instance is displayed in the Instances Tree. Note that if you set the Sync Mode to OFF and the Instance ID does not exist in the debug server, the following error message is displayed:
Instance '[LU Name]:[Instance ID]' was not found and sync is disabled.
Double-click the Instance ID to open the Instances Tree drop-down list.
- Click the Instance DB file to display its tables under the Instance DB Tree.
Double-click a table to display its data and then right-click the table to open a context menu with the following options:
a. Show Data, displays the table’s data.
b. Show Schema, displays the table’s structure.
c. Show Indexes, displays the table’s indexes, if defined.
Click for more information about Logical Units.
What Are the Data Viewer Components?
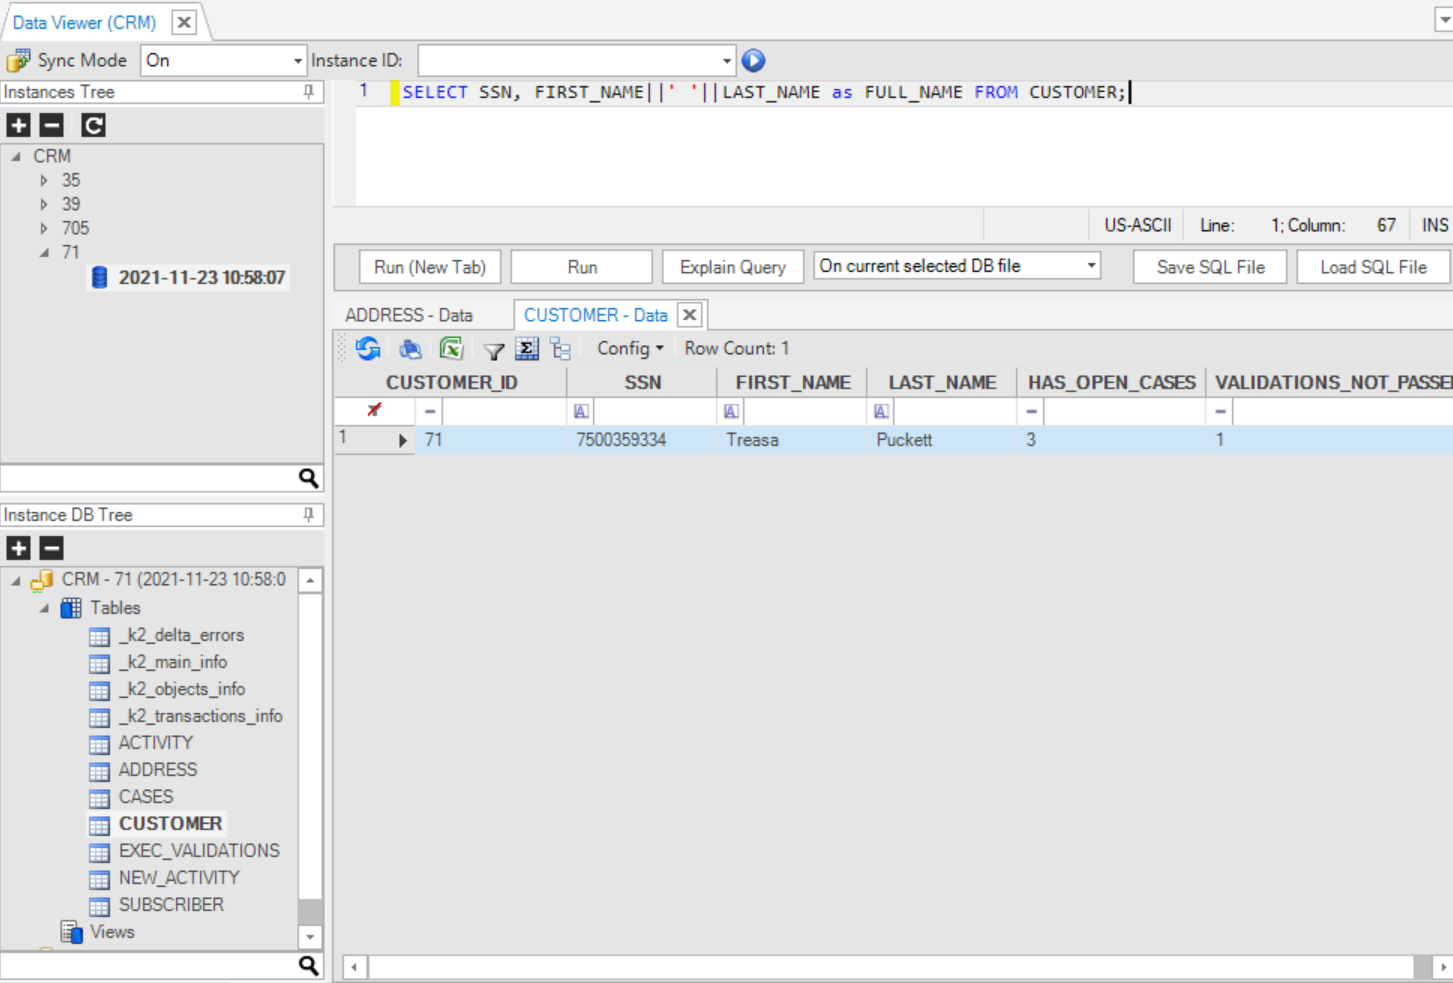
The Logical Unit Data Viewer contains the following areas and components:
- Sync Mode and Instance ID
- Instances Tree
- Instance DB Tree
- Scripting Area
- Results Pane and Toolbar
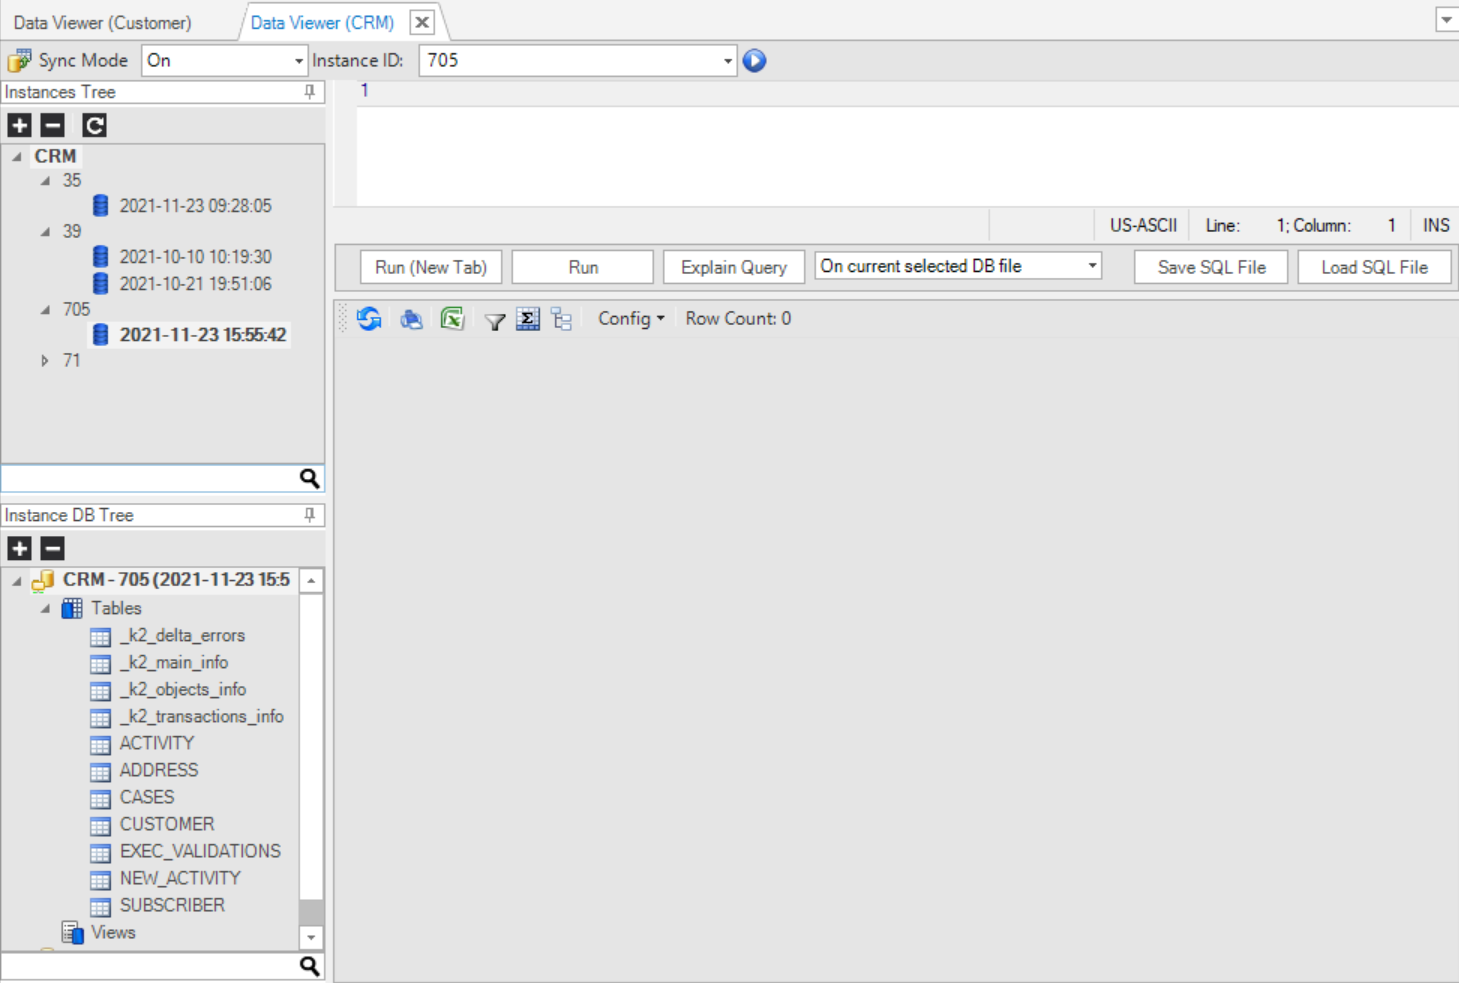
Sync Mode and Instance ID
This area has the following components:
Import DB File 
When clicked, it allows you to browse to an external Data Viewer file and load it.
Sync Mode
Set the Sync Mode for the GET LUI command, initiated by the execution of the Data Viewer. The options are On, Off and Force. The default mode is On.
Instance ID
To complete this field, do either:
Enter a specific Instance ID value.
Select a previously stored Instance ID from the drop-down list.
Write a project (java) function to generate the Instance ID. Note that this function must return a string as an output. Once you have created such function, use the function name in the Instance ID field (that is, do not enter the code that contains the function).
For example:
Create an Instance ID by using the function: fnCreateInstID. This function takes an input value and adds 10:
  if (i_id!=null && !i_id.isEmpty()){
     return Integer.sum(Integer.valueOf(i_id),10)+"";
   }
  return "0";
More complex functions can be written, of course, such as generating a random Instance ID or an Instance ID that complies with other criteria (such as certain values).
Play
When the  icon is clicked, the data file of the Instance ID is retrieved and saved for debugging.
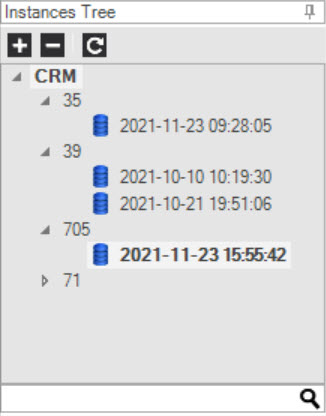
Instances Tree
The Instance Tree area (top left) displays a tree of available data files in the following order:
- LU
- Instance
- Dated file name
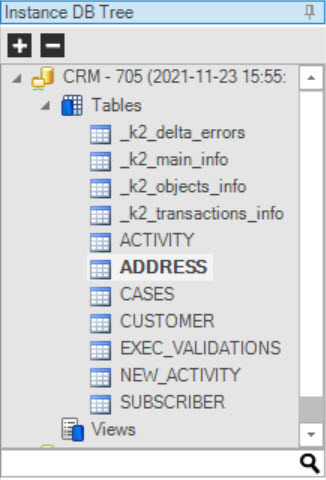
Instance DB Tree
The Instance DB Tree area (bottom left) displays the Table Tree, which includes:
k2_delta_errors - holds information on errors, including when each error occurred.
k2_main_info - holds basic information about the LU, like the LU Name and its Instance ID.
k2_objects_info - holds information for each of the objects in the selected instance.
k2_transactions_info - holds basic information about each transaction (ID and timestamp).
Reference tables under k2_Ref - these are displayed only as part of the Instance DB Tree, when the reference object is enabled in the LU Schema's properties.
To display the values of a table in the Tree, right-click the table and select either:
- Show Data, to display the table or view it in the Results pane.
- Show Schema, to display the table structure in the Results pane.
- Show Indexes, to display the table indexes in the Results pane.
Results Pane and Toolbar
(Bottom right) Displays the data or schema requested with the row count.
|
Print results |
|
Export results as an Excel file |
|
Filter results by one or more columns |
|
Toggle groupings |
|
Toggle summaries |
|
Refresh view |


Scripting Area
The SQL Scripting Area (upper-right pane) is used for writing and running SQL statements on a selected LUDB.
The following options are supported:
How Do I Run an SQL Statement in the Data Viewer?
Run and execute the SQL statement from the Scripting Area on the selected DB file:
- Enter the SQL statement using SQLite syntax into the Scripting Area.
- Select the DB file to be used to run the statement from the drop-down list.
- Do the following:\ a. Click Run or Run on New Tab under the Scripting Area.\ b. Press F5 or Ctrl + Enter. Separate multiple queries with ‘;’.
- View results in the Results pane.
How Do I Export a Logical Unit Data File?
- Go to the Instances Tree and right-click the DB File.
- Click Export Selected DB Files and select the Location and File Name of the exported file (LUDB format).
- Save your changes.
Additional (Right-Click) DB File Options
- Open DB - opens the Instance DB Tree of the selected DB files.
- Delete Selected DB Files - deletes the selected Instance DB files from the project folder: Fabric\[project name]\Implementation\LogicalUnits\[LU name]\VirtualDB_Data.
Notes
The latest Data Viewer file can be used in the following components:
- New functions / Web Services - the latest Data Viewer is displayed in the Database's drop-down list, whereby the LU table can be invoked on the code. Click for more information on How to Create a New Project Function.
- LU Schema - create a new table, based on SQL Options, to open the DB query where you can select the latest Data Viewer file. Click for more information about Adding a Table to a Schema.
- Population object / DB query - to display the latest Data Viewer file in the Database's drop-down list. Click for more information about Creating a New Table Population.
- Debugging population objects. Click for more information about Debugging a Table Population.
How Do I View Data in a Logical Unit?
The Data Viewer is accessible via the LU Schema:
- Go to Project Tree > click on Logical Units / Data Products
- Expand the relevant LU and open its Schema.
Studio provides 2 methods to view an LUI's data:
- Table Data Viewer - provides an insight into each table's content data, easily and quickly, by navigating between the LU tables that are shown in the schema diagram.
- Data Viewer - allows to build queries and execute them. This can be useful in case of a cross-table queries creation.
Table Data Viewer
To open the Table Data Viewer, click on  , which appears at the Schema Editor's Toolbar. Once clicked, a panel opens at the bottom of the Schema's window.
The panel is divided into 3 main areas:
Top bar - displays the selected table's name on the left side (the root table is displayed by default, but any table can be selected). In the middle, there are 3 action elements - the Sync Mode determines when syncing occures, the Instance ID field is for entering the unique LUI identifier, and the Execute button triggers the retrieval of the specified LUI based on the selected table, including any transformation logic, if applicable. Clicking the Execute button activates the Fabric GET command, which follows the behavior of the defined Sync method.
When the LUI is retrieved and all of its the table content is shown in the main area, additional action elements appear on the right side - filter columns and export table content to CSV. These capabilities are similar to those enabled in the Query Builder results window.
The main area - where the table's data are shown. This area and its capabilities - like filtering, sorting or grouping - are the same as those enabled in the Query Builder results window.
Bottom information bar - presents the execution status, and whether succeeded, and the number of entries/rows that are shown for the selected table (up to 1000 rows).
To view another table's content data of this LUI, simply click on it in the schema.
The panel's height can be adjusted according to user's preferences and needs, by moving the mouse to the horizontal line that separates the Schema's window. You will then see the 4-dots symbol and the cursor will turn into a resize mode.
NOTES:
- Clicking on the Execute button will first save the Schema and deploy the LU, in case it was changed.
- If you have made changes in the Schema, you should click on the Execute button again, in order to view how they affected the LUI content.
- When changing the Sync Mode or cleaning the Instance ID field - the window is reset and the displayed content is cleared. This is done in order to avoid confusion of what is currently being displayed.
To close the Table Data Viewer panel, click on the X in its upper-right corner.
Data Viewer
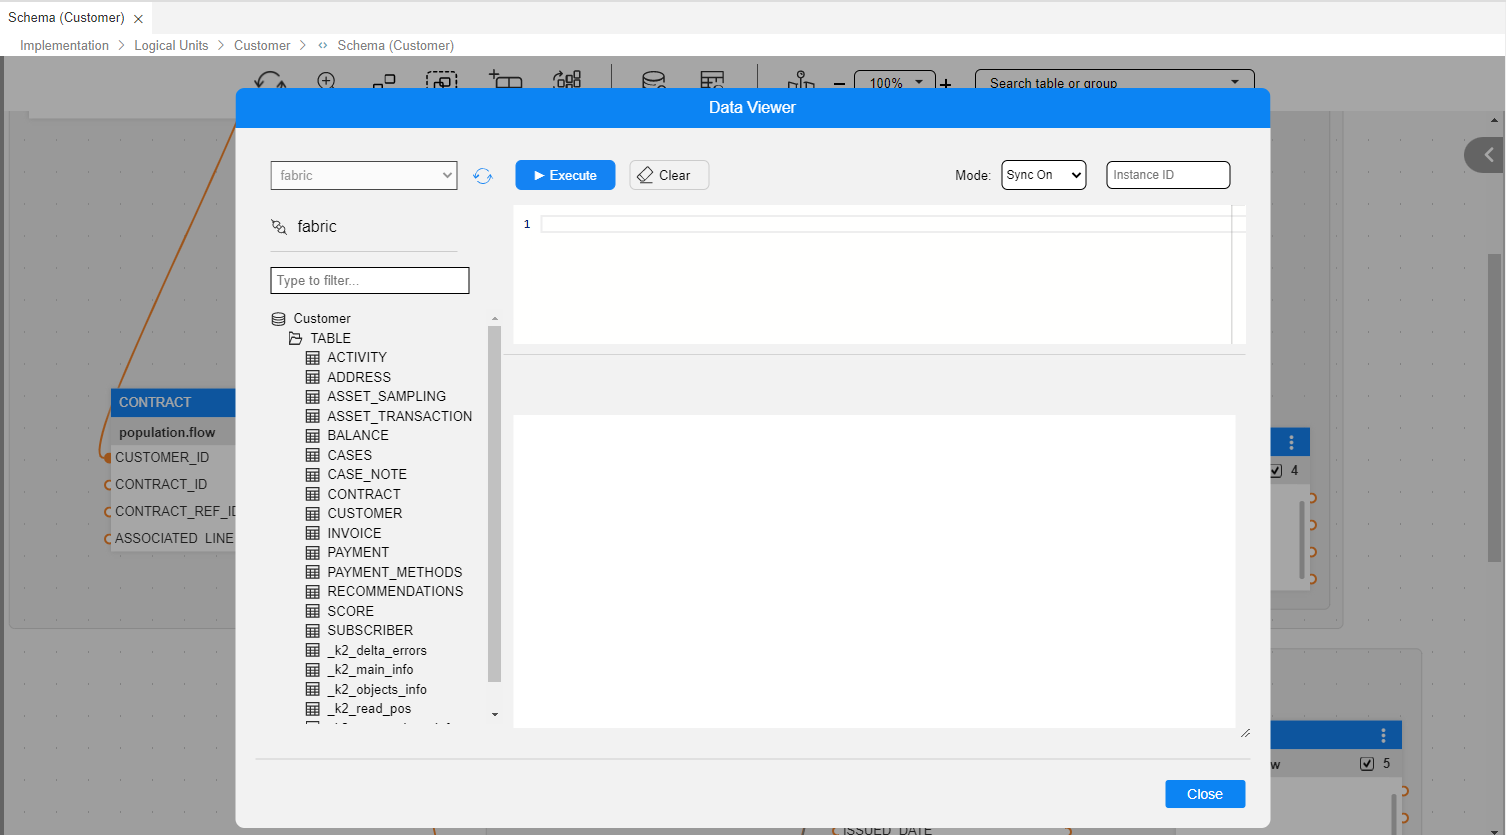
To open the Data Viewer, click on  , which appears at the Schema Editor's Toolbar. Once clicked, a Data Viewer popup window appears.
This is similar to other Query Builder popup windows, whereas here the interface - fabric - and the schema - the current LU - are preselected and are read-only.
The list of LU tables is already expanded within the DB Explorer on the left side.
The LU tables' list also includes several built-in LU tables that contain statistical information about the specific LUI. These built-in tables are not displayed in the LU Schema. For example:
- k2_main_info - holds basic information about the LU, like an LU Name and an Instance ID.
- k2_objects_info - holds information for each of the objects (=tables) in the selected instance. For example, what populations are used for each table, how much time it has taken to populate each table, how many records have been retrieved for each table, and how much time it has taken to load the data into Fabric.
A Sync Mode drop-down list and an Instance ID field appear in the upper-right corner.
Similar to the Table Data Viewer:
- The data results area, has the same capabilities as enabled in the Query Builder results window, like filtering, sorting and grouping.
- Bottom information bar, presents the execution status and whether succeeded, and the number of entries/rows that are shown for the selected table (up to 1000 rows).
NOTES:
- Clicking on the Execute button will first save the Schema and deploy the LU, if it was changed, before a popup is opened.
- When changing the Sync Mode or cleaning the Instance ID field - the main results area is reset and the displayed content is cleared. This is done in order to avoid confusion of what is currently being displayed.
Get & Sync Modes
To get information about an Instance ID, you shall specify the retrieval mode.
Set the Sync Mode for the GET LUI command, initiated by the execution of the Data Viewer. The 3 Sync Mode options are On, Off and Force. The default mode is On.
Moreover, the Data Viewer provides a fourth Sync Mode, named "New", that when selected, the LU Instance is first deleted and then it is retrieved again from scratch. (Such an option also appears in Broadway Debug Population Mode).

Data Viewer
The Data Viewer enables you to view a Logical Unit Instance database (MicroDB) tables' content, which is useful for testing and defect resolutions. As an LUI is associated to an LU, the viewing of its data is accessible from the LU context within the Studio.
How Do I View Data in a Logical Unit?
Go to the Project Tree, click Logical Units and verify that the LU has a green icon, indicating that it is deployed to the debug server. If the LU has a white icon, deploy it to the debug server before running the Data Viewer on it. Do either:
- Right-click the LU > Deploy To debug.
- Click the Deploy icon, located at the top of Fabric's Debug Panel.
Click on
next to the selected LU to open the Data Viewer window.Set the Sync Mode in the top left pane; the default Sync Mode is ON.
In the Instance ID field (top central pane) - enter an Instance ID (IID).
Click
Play to generate a new Data Viewer file.
Fabric runs the GET LUI command on the debug server of the selected Instance ID. Each sync of an LUI creates a new *.db SQLite file for the LU instance. The LU Instance is displayed in the Instances Tree. Note that if you set the Sync Mode to OFF and the Instance ID does not exist in the debug server, the following error message is displayed:
Instance '[LU Name]:[Instance ID]' was not found and sync is disabled.
Double-click the Instance ID to open the Instances Tree drop-down list.
- Click the Instance DB file to display its tables under the Instance DB Tree.
Double-click a table to display its data and then right-click the table to open a context menu with the following options:
a. Show Data, displays the table’s data.
b. Show Schema, displays the table’s structure.
c. Show Indexes, displays the table’s indexes, if defined.
Click for more information about Logical Units.
What Are the Data Viewer Components?
The Logical Unit Data Viewer contains the following areas and components:
- Sync Mode and Instance ID
- Instances Tree
- Instance DB Tree
- Scripting Area
- Results Pane and Toolbar
Sync Mode and Instance ID
This area has the following components:
Import DB File
When clicked, it allows you to browse to an external Data Viewer file and load it.
Sync Mode
Set the Sync Mode for the GET LUI command, initiated by the execution of the Data Viewer. The options are On, Off and Force. The default mode is On.
Instance ID
To complete this field, do either:
Enter a specific Instance ID value.
Select a previously stored Instance ID from the drop-down list.
Write a project (java) function to generate the Instance ID. Note that this function must return a string as an output. Once you have created such function, use the function name in the Instance ID field (that is, do not enter the code that contains the function).
For example:
Create an Instance ID by using the function: fnCreateInstID. This function takes an input value and adds 10:
  if (i_id!=null && !i_id.isEmpty()){
     return Integer.sum(Integer.valueOf(i_id),10)+"";
   }
  return "0";
More complex functions can be written, of course, such as generating a random Instance ID or an Instance ID that complies with other criteria (such as certain values).
Play
When the icon is clicked, the data file of the Instance ID is retrieved and saved for debugging.
Instances Tree
The Instance Tree area (top left) displays a tree of available data files in the following order:
- LU
- Instance
- Dated file name
Instance DB Tree
The Instance DB Tree area (bottom left) displays the Table Tree, which includes:
k2_delta_errors - holds information on errors, including when each error occurred.
k2_main_info - holds basic information about the LU, like the LU Name and its Instance ID.
k2_objects_info - holds information for each of the objects in the selected instance.
k2_transactions_info - holds basic information about each transaction (ID and timestamp).
Reference tables under k2_Ref - these are displayed only as part of the Instance DB Tree, when the reference object is enabled in the LU Schema's properties.
To display the values of a table in the Tree, right-click the table and select either:
- Show Data, to display the table or view it in the Results pane.
- Show Schema, to display the table structure in the Results pane.
- Show Indexes, to display the table indexes in the Results pane.
Results Pane and Toolbar
(Bottom right) Displays the data or schema requested with the row count.
|
Print results |
|
Export results as an Excel file |
|
Filter results by one or more columns |
|
Toggle groupings |
|
Toggle summaries |
|
Refresh view |
Scripting Area
The SQL Scripting Area (upper-right pane) is used for writing and running SQL statements on a selected LUDB.
The following options are supported:
How Do I Run an SQL Statement in the Data Viewer?
Run and execute the SQL statement from the Scripting Area on the selected DB file:
- Enter the SQL statement using SQLite syntax into the Scripting Area.
- Select the DB file to be used to run the statement from the drop-down list.
- Do the following:\ a. Click Run or Run on New Tab under the Scripting Area.\ b. Press F5 or Ctrl + Enter. Separate multiple queries with ‘;’.
- View results in the Results pane.
How Do I Export a Logical Unit Data File?
- Go to the Instances Tree and right-click the DB File.
- Click Export Selected DB Files and select the Location and File Name of the exported file (LUDB format).
- Save your changes.
Additional (Right-Click) DB File Options
- Open DB - opens the Instance DB Tree of the selected DB files.
- Delete Selected DB Files - deletes the selected Instance DB files from the project folder: Fabric\[project name]\Implementation\LogicalUnits\[LU name]\VirtualDB_Data.
Notes
The latest Data Viewer file can be used in the following components:
- New functions / Web Services - the latest Data Viewer is displayed in the Database's drop-down list, whereby the LU table can be invoked on the code. Click for more information on How to Create a New Project Function.
- LU Schema - create a new table, based on SQL Options, to open the DB query where you can select the latest Data Viewer file. Click for more information about Adding a Table to a Schema.
- Population object / DB query - to display the latest Data Viewer file in the Database's drop-down list. Click for more information about Creating a New Table Population.
- Debugging population objects. Click for more information about Debugging a Table Population.
How Do I View Data in a Logical Unit?
The Data Viewer is accessible via the LU Schema:
- Go to Project Tree > click on Logical Units / Data Products
- Expand the relevant LU and open its Schema.
Studio provides 2 methods to view an LUI's data:
- Table Data Viewer - provides an insight into each table's content data, easily and quickly, by navigating between the LU tables that are shown in the schema diagram.
- Data Viewer - allows to build queries and execute them. This can be useful in case of a cross-table queries creation.
Table Data Viewer
To open the Table Data Viewer, click on , which appears at the Schema Editor's Toolbar. Once clicked, a panel opens at the bottom of the Schema's window.
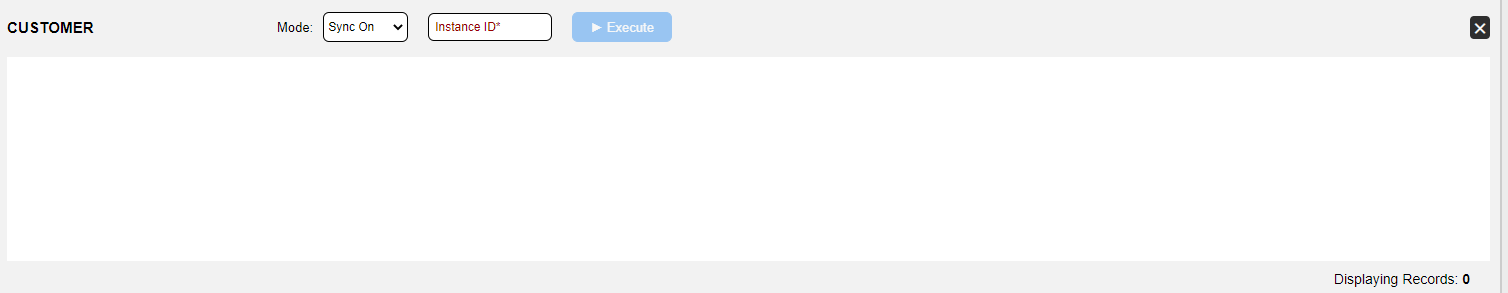
The panel is divided into 3 main areas:
Top bar - displays the selected table's name on the left side (the root table is displayed by default, but any table can be selected). In the middle, there are 3 action elements - the Sync Mode determines when syncing occures, the Instance ID field is for entering the unique LUI identifier, and the Execute button triggers the retrieval of the specified LUI based on the selected table, including any transformation logic, if applicable. Clicking the Execute button activates the Fabric GET command, which follows the behavior of the defined Sync method.
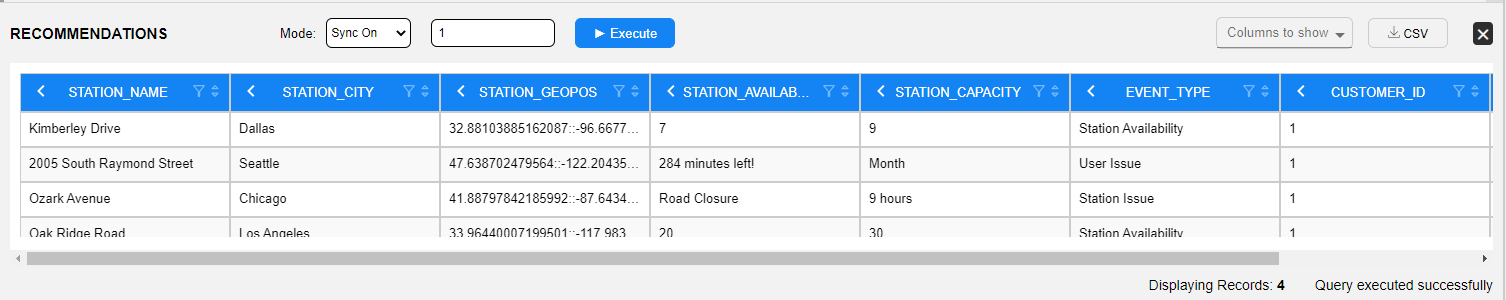
When the LUI is retrieved and all of its the table content is shown in the main area, additional action elements appear on the right side - filter columns and export table content to CSV. These capabilities are similar to those enabled in the Query Builder results window.
The main area - where the table's data are shown. This area and its capabilities - like filtering, sorting or grouping - are the same as those enabled in the Query Builder results window.
Bottom information bar - presents the execution status, and whether succeeded, and the number of entries/rows that are shown for the selected table (up to 1000 rows).
To view another table's content data of this LUI, simply click on it in the schema.
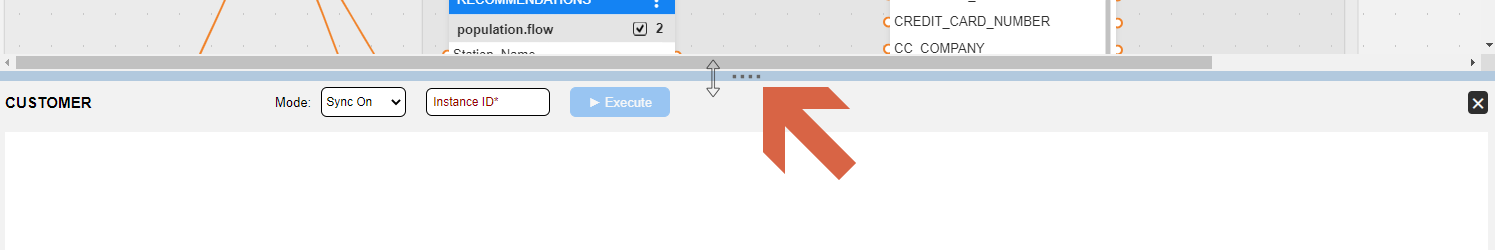
The panel's height can be adjusted according to user's preferences and needs, by moving the mouse to the horizontal line that separates the Schema's window. You will then see the 4-dots symbol and the cursor will turn into a resize mode.
NOTES:
- Clicking on the Execute button will first save the Schema and deploy the LU, in case it was changed.
- If you have made changes in the Schema, you should click on the Execute button again, in order to view how they affected the LUI content.
- When changing the Sync Mode or cleaning the Instance ID field - the window is reset and the displayed content is cleared. This is done in order to avoid confusion of what is currently being displayed.
To close the Table Data Viewer panel, click on the X in its upper-right corner.
Data Viewer
To open the Data Viewer, click on , which appears at the Schema Editor's Toolbar. Once clicked, a Data Viewer popup window appears.
This is similar to other Query Builder popup windows, whereas here the interface - fabric - and the schema - the current LU - are preselected and are read-only.
The list of LU tables is already expanded within the DB Explorer on the left side.
The LU tables' list also includes several built-in LU tables that contain statistical information about the specific LUI. These built-in tables are not displayed in the LU Schema. For example:
- k2_main_info - holds basic information about the LU, like an LU Name and an Instance ID.
- k2_objects_info - holds information for each of the objects (=tables) in the selected instance. For example, what populations are used for each table, how much time it has taken to populate each table, how many records have been retrieved for each table, and how much time it has taken to load the data into Fabric.
A Sync Mode drop-down list and an Instance ID field appear in the upper-right corner.
Similar to the Table Data Viewer:
- The data results area, has the same capabilities as enabled in the Query Builder results window, like filtering, sorting and grouping.
- Bottom information bar, presents the execution status and whether succeeded, and the number of entries/rows that are shown for the selected table (up to 1000 rows).
NOTES:
- Clicking on the Execute button will first save the Schema and deploy the LU, if it was changed, before a popup is opened.
- When changing the Sync Mode or cleaning the Instance ID field - the main results area is reset and the displayed content is cleared. This is done in order to avoid confusion of what is currently being displayed.
Get & Sync Modes
To get information about an Instance ID, you shall specify the retrieval mode.
Set the Sync Mode for the GET LUI command, initiated by the execution of the Data Viewer. The 3 Sync Mode options are On, Off and Force. The default mode is On.
Moreover, the Data Viewer provides a fourth Sync Mode, named "New", that when selected, the LU Instance is first deleted and then it is retrieved again from scratch. (Such an option also appears in Broadway Debug Population Mode).
