

Broadway Profiler
When running a Broadway flow, the Profiler can be enabled so that a results breakdown per Flow / Stage / Actor / Iteration can be seen. The Profiler is enabled either via the Fabric Studio, or by using the broadway command.
The Profiler provides the metrics per a single flow execution. However, when you need to monitor the behavior across many executions, you can use JMX Statistics, which also provides performance metrics per Flow / Stage / Actor / Iteration.
Trace can also be enabled on Broadway flows and can help to analyze the flow results.
How Do I Enable the Profiler in the Studio?
- To enable the Profiler, click Actions > Profiler in the Main menu toolbar and run the flow.
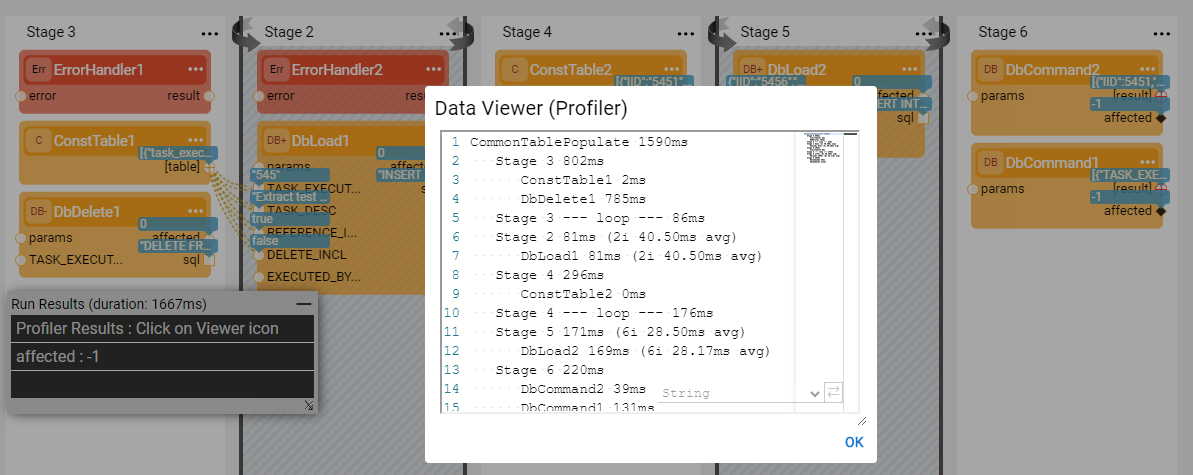
- Once the flow is completed, "Profiler Results: Click on the Viewer icon" line is displayed in the Run Results window below the flow results.
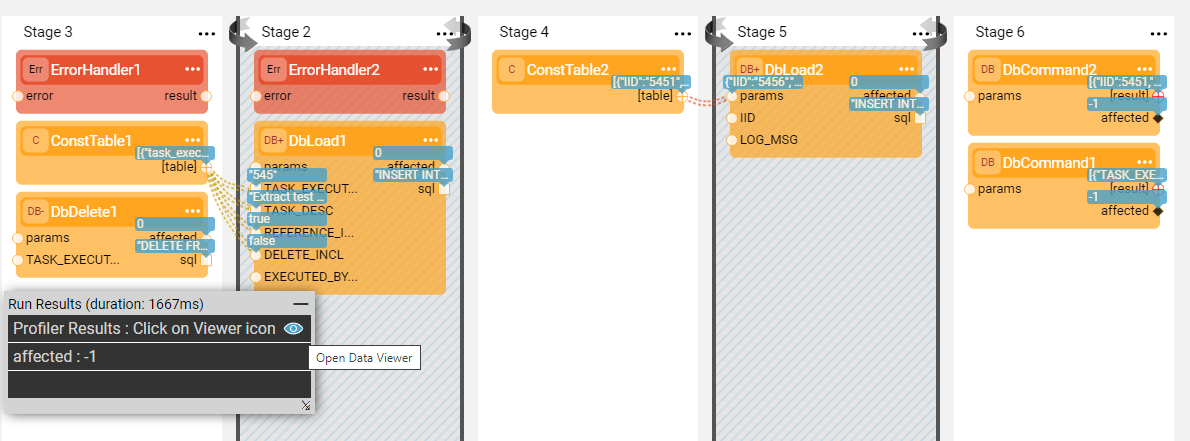
- Click on the
 icon to view the Profiler results:
How Do I Run the Profiler Via the Broadway Command?
To invoke the Profiler when running the flow using the broadway command, set the profilerTelemetry argument to true . This will add the Profiler results to the command results.
fabric>broadway CRM.callGraphIt profilerTelemetry=true;
|column           |value                                                       |
+-----------------+------------------------------------------------------------+
|profilerTelemetry|callGraphIt 37ms
   Stage 1 6ms
      Http1 4ms
   Stage 2 18ms
      Http2 18ms|
(1 rows)


Broadway Profiler
When running a Broadway flow, the Profiler can be enabled so that a results breakdown per Flow / Stage / Actor / Iteration can be seen. The Profiler is enabled either via the Fabric Studio, or by using the broadway command.
The Profiler provides the metrics per a single flow execution. However, when you need to monitor the behavior across many executions, you can use JMX Statistics, which also provides performance metrics per Flow / Stage / Actor / Iteration.
Trace can also be enabled on Broadway flows and can help to analyze the flow results.
How Do I Enable the Profiler in the Studio?
- To enable the Profiler, click Actions > Profiler in the Main menu toolbar and run the flow.
- Once the flow is completed, "Profiler Results: Click on the Viewer icon" line is displayed in the Run Results window below the flow results.
- Click on the icon to view the Profiler results:
How Do I Run the Profiler Via the Broadway Command?
To invoke the Profiler when running the flow using the broadway command, set the profilerTelemetry argument to true . This will add the Profiler results to the command results.
fabric>broadway CRM.callGraphIt profilerTelemetry=true;
|column           |value                                                       |
+-----------------+------------------------------------------------------------+
|profilerTelemetry|callGraphIt 37ms
   Stage 1 6ms
      Http1 4ms
   Stage 2 18ms
      Http2 18ms|
(1 rows)
