

Fabric Studio User Interface
What Is the Fabric Studio?
Fabric Studio is a designer tool that manages the construction of Digital Entities. As an integrated tool, Fabric allows you to implement mapping rules into a project and to deploy your implementation to the Fabric Server.
Fabric Studio offers a user-friendly look-and-feel development environment known as the Implementation Layer. Each project is initiated and maintained via this platform and working space.
As an integrated tool, Fabric Studio allows you to:
- Design Digital Entities and their associated Logical Units (LUs).
- Use robust ETL (Extract, Transform, Load) options in order to define the mapping logic for various tables in the LUs. The transformation objects that are used may be Functions or Globals as well as Translations.
- Deploy a Fabric project or selected components of a project into the Fabric runtime environment.
- Debug and view mapped data, data flow and data exposure.
Additionally, the Fabric Studio enables you to integrate your projects into source version control systems based on either Git or the Apache Subversion (SVN) standard.
Get Started
Start Page
Upon opening the desktop Studio, the Start Page will appear.
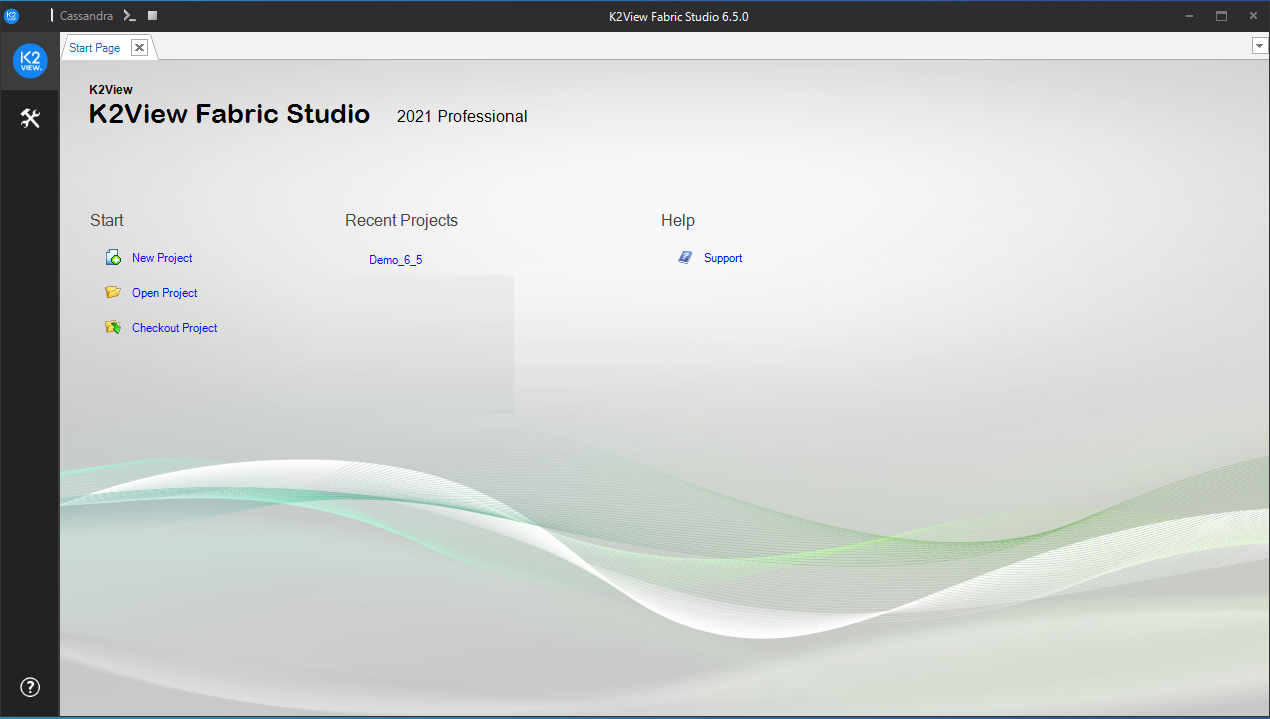
The Start Page has links, including:
- Start a new project, with or without configuration control.
- Open an existing project.
- Checkout a project from a source versioning control.
- Quick links to recently opened projects.
- Help and support.
Click for more information about Creating a New Project.
Click the K2View icon on the top left corner of the Studio in order to restore, move, change size, minimize, maximize or close the Fabric Studio.
The Start Page can be reopened, even after it is closed, by using the Tools actions.
Once a project is opened, the debug panel appears on the upper left side of the window, and the activity toolbar appears along the left side of the window.
Debug Panel

The debug panel enables access to the Fabric debug server, Cassandra debug server and to the Fabric Web Admin. The debug panel is divided into two main areas: Fabric and Cassandra:
Fabric |
|
|
Deploy all updated LUs into Fabric debug server (appears white before the deploy, green after a successful deploy) |
|
Open Fabric console. Opens the console of the debug Fabric server with the appropriate port for each Fabric project. |
|
Open the Fabric Web Admin on the localhost. |
|
|
Start and stop Fabric debug console. |
|
Run Reset Drop on the Fabric debug server. |
Cassandra |
|
|
Open Cassandra console for cqlsh commands. |
|
|
Start and stop Cassandra console. |


Activity Toolbar
|
file |
|
New Item (CTRL+N)
|
|
Project Tree (CTRL+T) |
|
Query Builder |
|
Tools |
|
Server Activity |
|
Help (link to the support) |


File Tab
The File tab has the following options:
- New Project.
- Open Project.
- Checkout Project (from SVN or Git repository).
- Close Project.
- Recent Projects.
New Item Tab
Click New Item to open a New Item under a selected LU or under Shared Objects:
- Select an LU from the current Logical Unit dropdown list in order to create the new item under the selected LU. Examples for such new items are Function, LU Table, Interface or Global.
- In order to create a new item under Shared Objects, the current Logical Unit dropdown list should be empty.
Note that this area allows you to open a new item only for LU or for Shared Objects.
The Fabric Web Studio has a simple and intuitive layout. Like many other code editors (also called IDE - Integrated Development Environment), it adopts a common user interface and layout, maximizing the space provided for the editor while leaving enough room to browse and access the full context of your project.
Basic Layout
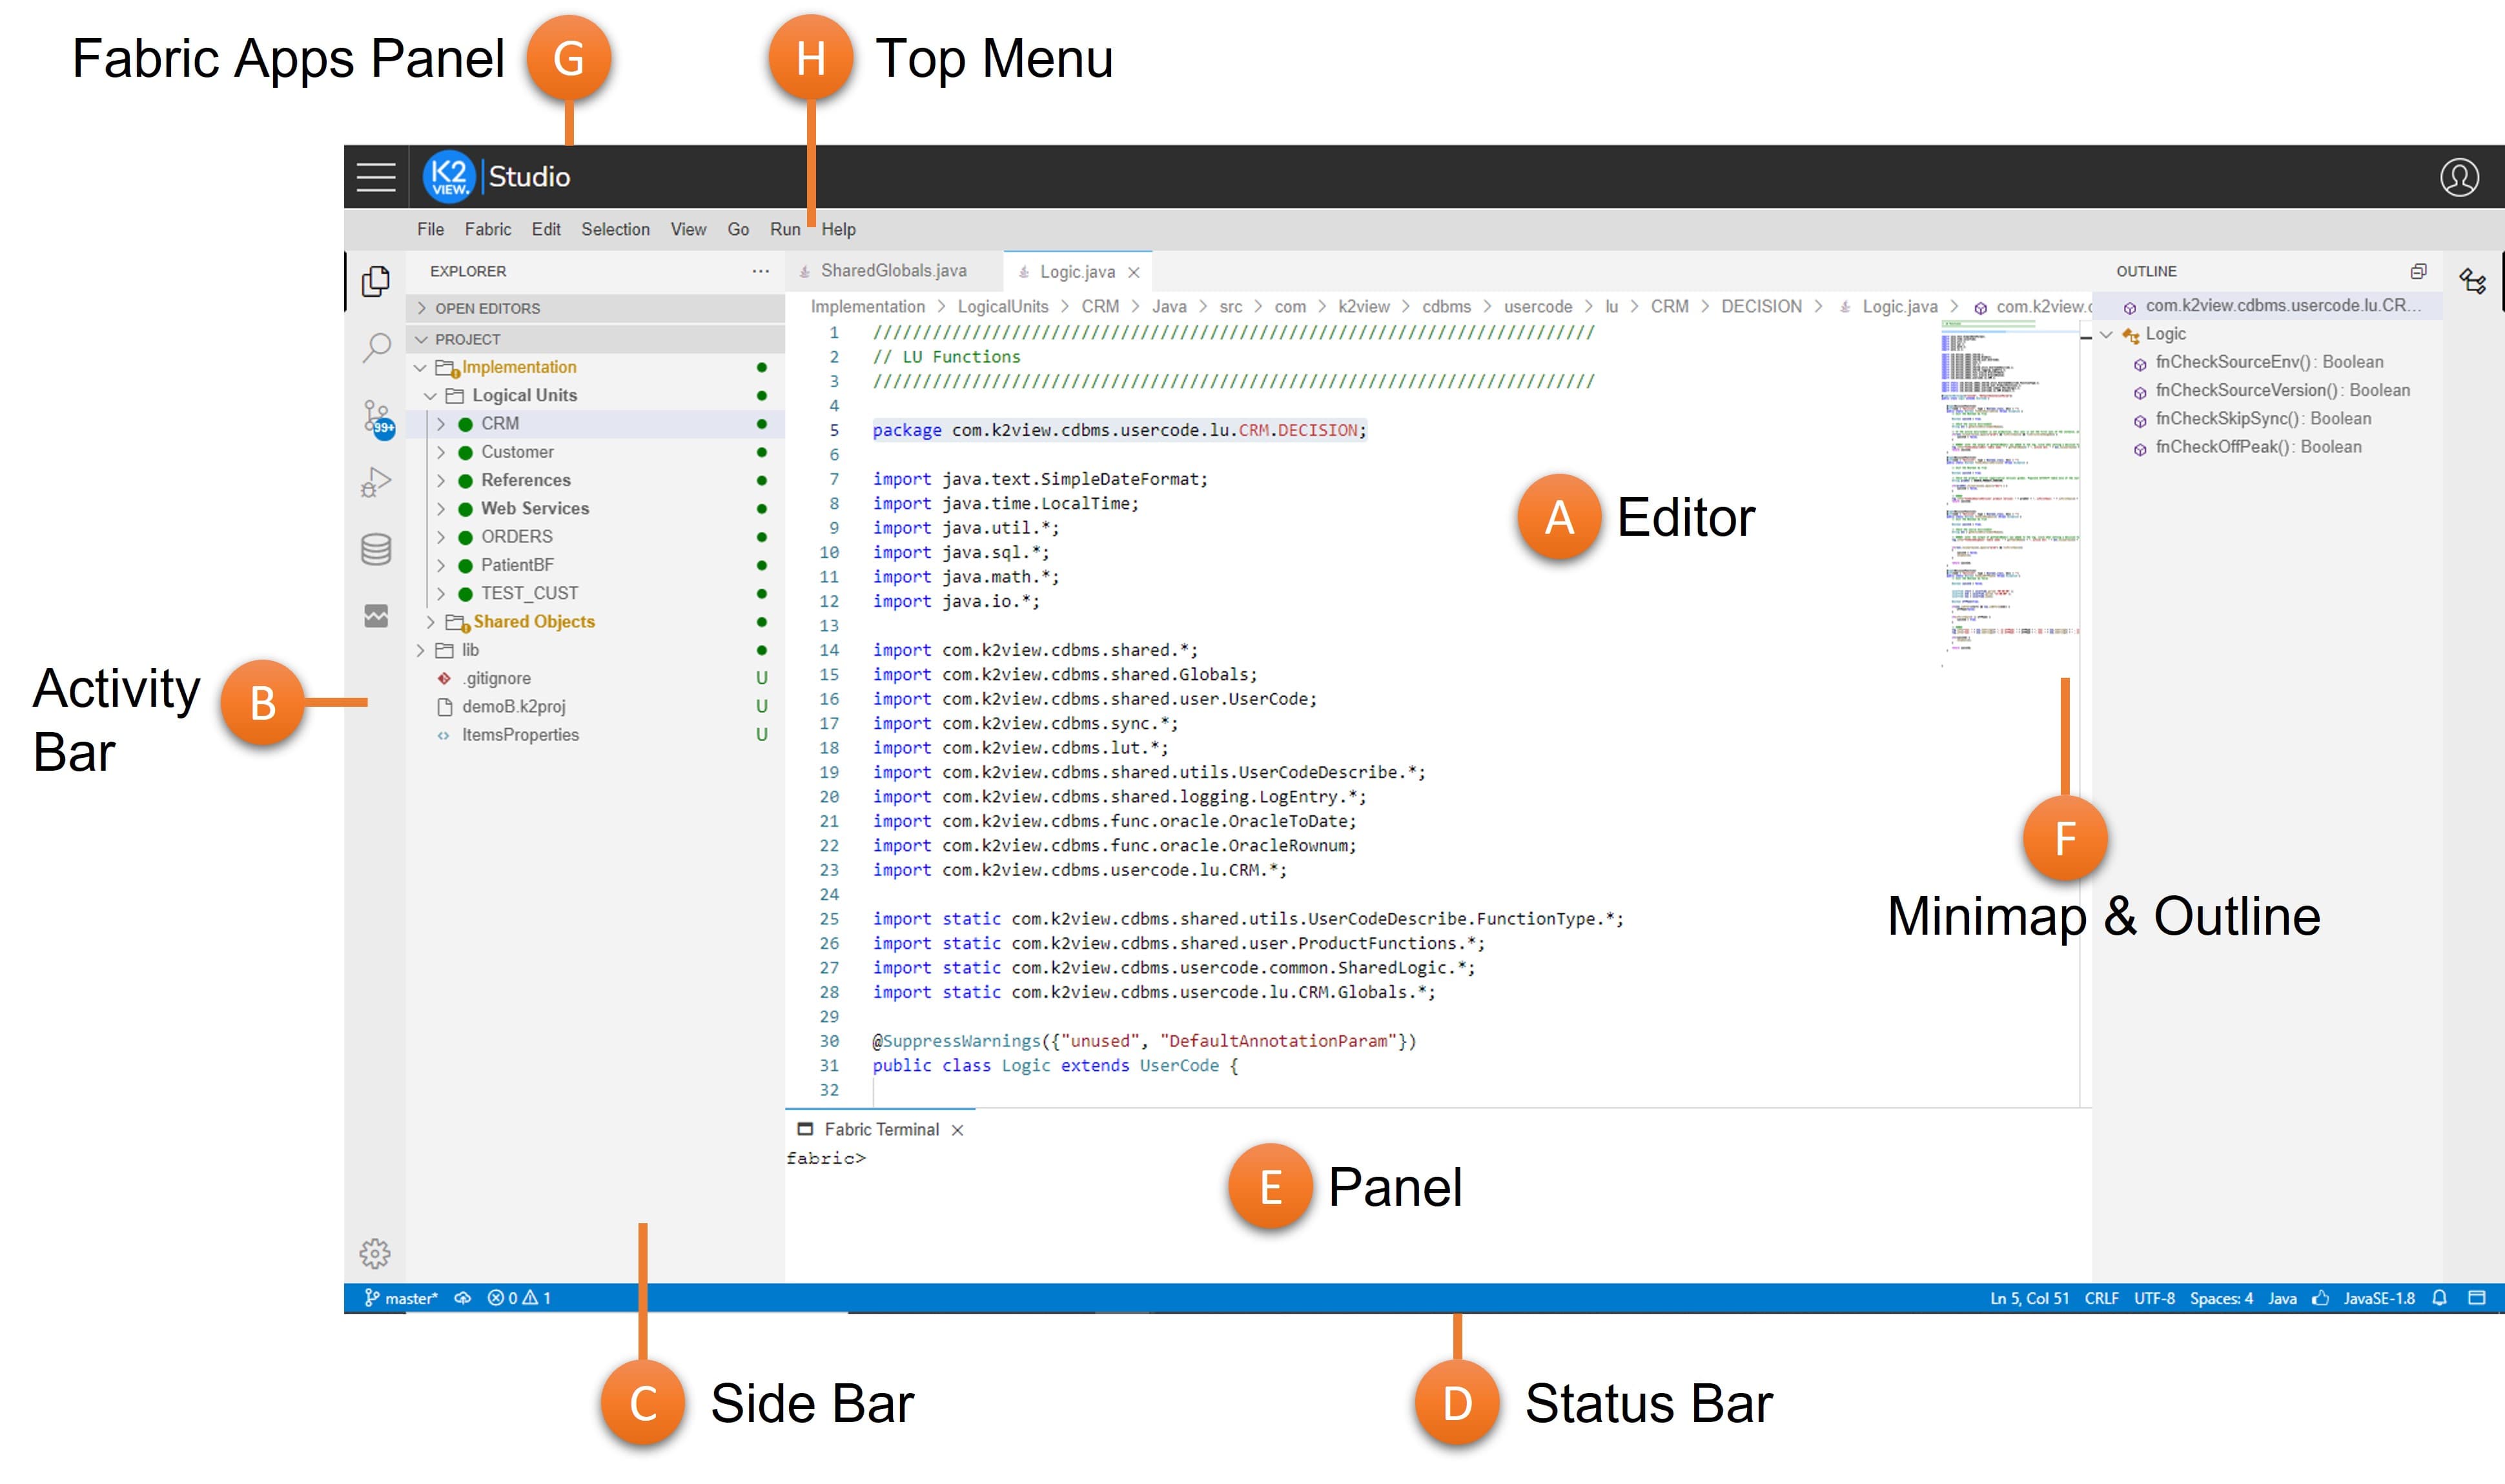
The Fabric Web Studio adopts Visual Studio Code concepts. The UI is divided into several main areas:
- Editor (A) - The main area in which you edit all your project files and entities. You may open as many editors as you like side by side vertically and horizontally.
- Activity Bar (B) - Located on the far left-hand side and allows you to switch between views and gives you additional context-specific indicators, like the number of outgoing changes when Git is enabled.
- Side Bar (C) - Contains different views, like the Explorer, assisting you while working on your Fabric project.
- Status Bar (D) - Information about the open project and the files you are editing.
- Panel (E) - Displays different panel modules below the editor area. Examples for such panel modules are the Fabric Terminal, Problems (comprised of compilation errors and warnings) and Debug Information. These can be dragged to the right side of the screen, allowing for more vertical space.
- Minimap & Outline (F) - Code outline, provides you with a high-level overview of your source code, which is useful for a quick navigation and a code comprehension. A file's minimap is shown on the right side of the editor. You can click or drag the shaded area in order to quickly jump to different sections of your file. The minimap is shown only for some of the editors (mainly code editors) and when using those editors you can also click on the Outline icon at top right, which, when expanded, shows the symbol tree of the currently active editor.
- Fabric Apps Panel (G) - Since the Web Studio works as part of the Fabric Web Platform, you can navigate to its other apps via this panel.
- Top Menu (H) - From the top menu you can either carry out IDE operations or activate certain Fabric commands.
Tip: You can reorganize the editors and panels, placing them in convenient locations. Drag and drop the editor or the panel tab in order to reposition the editor or the panel in the desired location on the screen.
Activity Bar and Views
The Activity Bar lets you switch quickly between views. Once you click on a view, the Side Bar changes accordingly and allows you to make the relevant operations for this view.
The Web Studio comes with several default views in the Activity Bar, as described below. You can open those, as well as other views, using the View: Open View command. Selecting a view, adds it to the Activity Bar.
The views that appear by default on the Web Studio are as follows:
 |
File Explorer | Used to browse, open, and edit the files in your project. When selected, the Side Bar shows the project tree, enabling you to open and edit files or make other actions using the context menu. To learn more how to explore files in your project see here. |
 |
Search | Provides a global search and replace across your project files. This tool, which is opened from the Side Bar, allows you make smart searches using various filters. To learn more about using the Search tool within the Web Studio see here. |
 |
Source Control | Git source View, shows the details of current repository changes and also enables comparing those changes to the origin, as well as making various source control actions. A badge appears on the Source Control icon at the Activity Bar showing how many changes you currently have in your repository. To learn more about using the Git tool within the Web Studio see here. |
 |
Debug | Run and Debug View displays variables, call stacks, and breakpoints. To learn more how to debug your project see here. |
 |
DB Interface Explorer | Enables exploring the project's DB interfaces, showing schemas, tables, views, and columns. According to the opened editor's context it lets you apply actions like: executing SQL queries at Query Builder, adding DB statements to Fabric functions, adding DB actors to Broadway and adding an SQL section to Graphit. To learn more about using the Git tool within the Web Studio see here. |
 |
Log Viewer | Enables you to select and view Fabric logs, in a rich and useful mode. When clicked it allows you to select which log to open (from the Side Bar). To learn more about Log Viewer and how to use it effectively see here. |
Tip: You can change the order of views in the Activity Bar by dragging and dropping them.
Command Palette
The Command Palette is an interactive window that provides access to the Fabric Web Studio functionality, including keyboard shortcuts for many common operations. You can open files, execute editor commands, and launch Fabric dedicated editors such as Create New LU, Create new Broadway flow and many more.
You can reach the Command Palette from the top menu by selecting View > Find command or use ⇧⌘P in Mac or F1 in Windows to bring it up.
To learn more about useful Command Palette commands and shortcuts see here.
Color Themes
As part of Web Studio Settings Capabilities, you can modify the colors in the Visual Studio Code's user interface to suit your preferences and work environment.
To select a color theme
- Open the Color Theme picker with File > Preferences > Color Theme. You can open it also by using the Preference gear icon
 located at the bottom left area of Web Studio.
 - Use the cursor keys to preview the colors of the theme.
- Select a desired theme and click Enter.
Notes:
- Fabric Web Studio is basically a Visual Studio code-like editor, with small differences. While you can look and learn from VS Code's many user guides, keep in mind that they are not the same.
- Fabric Web Studio follows the current Fabric Desktop Studio concept in terms of having a code editor orientation and being a file and folder based.
- Fabric Web Studio is fully compatible and compliant with the Desktop Studio. You can smoothly switch between them while implementing your project.
The Project Tree
The Project Tree displays the components of the current project as a hierarchy of entities. The project is the top-level in the hierarchy. Each project has the following branches (sub-objects):
- Shared Objects, the objects used by all Logical Units and project references.
- References, reference information that may be used throughout the instance. References includes also common project's tables.
- Web Services, a collection of all functions that are defined as Web Services for this project.
- Logical Units, a collection of all Logical Units defined in the project.
Click for more information about the Project Tree.
Click for more information about the Query Builder.
Click for more information Fabric Studio log file.

Fabric Studio User Interface
What Is the Fabric Studio?
Fabric Studio is a designer tool that manages the construction of Digital Entities. As an integrated tool, Fabric allows you to implement mapping rules into a project and to deploy your implementation to the Fabric Server.
Fabric Studio offers a user-friendly look-and-feel development environment known as the Implementation Layer. Each project is initiated and maintained via this platform and working space.
As an integrated tool, Fabric Studio allows you to:
- Design Digital Entities and their associated Logical Units (LUs).
- Use robust ETL (Extract, Transform, Load) options in order to define the mapping logic for various tables in the LUs. The transformation objects that are used may be Functions or Globals as well as Translations.
- Deploy a Fabric project or selected components of a project into the Fabric runtime environment.
- Debug and view mapped data, data flow and data exposure.
Additionally, the Fabric Studio enables you to integrate your projects into source version control systems based on either Git or the Apache Subversion (SVN) standard.
Get Started
Start Page
Upon opening the desktop Studio, the Start Page will appear.
The Start Page has links, including:
- Start a new project, with or without configuration control.
- Open an existing project.
- Checkout a project from a source versioning control.
- Quick links to recently opened projects.
- Help and support.
Click for more information about Creating a New Project.
Click the K2View icon on the top left corner of the Studio in order to restore, move, change size, minimize, maximize or close the Fabric Studio.
The Start Page can be reopened, even after it is closed, by using the Tools actions.
Once a project is opened, the debug panel appears on the upper left side of the window, and the activity toolbar appears along the left side of the window.
Debug Panel
The debug panel enables access to the Fabric debug server, Cassandra debug server and to the Fabric Web Admin. The debug panel is divided into two main areas: Fabric and Cassandra:
Fabric |
|
|
Deploy all updated LUs into Fabric debug server (appears white before the deploy, green after a successful deploy) |
|
Open Fabric console. Opens the console of the debug Fabric server with the appropriate port for each Fabric project. |
|
Open the Fabric Web Admin on the localhost. |
|
|
Start and stop Fabric debug console. |
|
Run Reset Drop on the Fabric debug server. |
Cassandra |
|
|
Open Cassandra console for cqlsh commands. |
|
|
Start and stop Cassandra console. |
Activity Toolbar
|
file |
|
New Item (CTRL+N)
|
|
Project Tree (CTRL+T) |
|
Query Builder |
|
Tools |
|
Server Activity |
|
Help (link to the support) |
File Tab
The File tab has the following options:
- New Project.
- Open Project.
- Checkout Project (from SVN or Git repository).
- Close Project.
- Recent Projects.
New Item Tab
Click New Item to open a New Item under a selected LU or under Shared Objects:
- Select an LU from the current Logical Unit dropdown list in order to create the new item under the selected LU. Examples for such new items are Function, LU Table, Interface or Global.
- In order to create a new item under Shared Objects, the current Logical Unit dropdown list should be empty.
Note that this area allows you to open a new item only for LU or for Shared Objects.
The Fabric Web Studio has a simple and intuitive layout. Like many other code editors (also called IDE - Integrated Development Environment), it adopts a common user interface and layout, maximizing the space provided for the editor while leaving enough room to browse and access the full context of your project.
Basic Layout
The Fabric Web Studio adopts Visual Studio Code concepts. The UI is divided into several main areas:
- Editor (A) - The main area in which you edit all your project files and entities. You may open as many editors as you like side by side vertically and horizontally.
- Activity Bar (B) - Located on the far left-hand side and allows you to switch between views and gives you additional context-specific indicators, like the number of outgoing changes when Git is enabled.
- Side Bar (C) - Contains different views, like the Explorer, assisting you while working on your Fabric project.
- Status Bar (D) - Information about the open project and the files you are editing.
- Panel (E) - Displays different panel modules below the editor area. Examples for such panel modules are the Fabric Terminal, Problems (comprised of compilation errors and warnings) and Debug Information. These can be dragged to the right side of the screen, allowing for more vertical space.
- Minimap & Outline (F) - Code outline, provides you with a high-level overview of your source code, which is useful for a quick navigation and a code comprehension. A file's minimap is shown on the right side of the editor. You can click or drag the shaded area in order to quickly jump to different sections of your file. The minimap is shown only for some of the editors (mainly code editors) and when using those editors you can also click on the Outline icon at top right, which, when expanded, shows the symbol tree of the currently active editor.
- Fabric Apps Panel (G) - Since the Web Studio works as part of the Fabric Web Platform, you can navigate to its other apps via this panel.
- Top Menu (H) - From the top menu you can either carry out IDE operations or activate certain Fabric commands.
Tip: You can reorganize the editors and panels, placing them in convenient locations. Drag and drop the editor or the panel tab in order to reposition the editor or the panel in the desired location on the screen.
Activity Bar and Views
The Activity Bar lets you switch quickly between views. Once you click on a view, the Side Bar changes accordingly and allows you to make the relevant operations for this view.
The Web Studio comes with several default views in the Activity Bar, as described below. You can open those, as well as other views, using the View: Open View command. Selecting a view, adds it to the Activity Bar.
The views that appear by default on the Web Studio are as follows:
|
File Explorer | Used to browse, open, and edit the files in your project. When selected, the Side Bar shows the project tree, enabling you to open and edit files or make other actions using the context menu. To learn more how to explore files in your project see here. |
|
Search | Provides a global search and replace across your project files. This tool, which is opened from the Side Bar, allows you make smart searches using various filters. To learn more about using the Search tool within the Web Studio see here. |
|
Source Control | Git source View, shows the details of current repository changes and also enables comparing those changes to the origin, as well as making various source control actions. A badge appears on the Source Control icon at the Activity Bar showing how many changes you currently have in your repository. To learn more about using the Git tool within the Web Studio see here. |
|
Debug | Run and Debug View displays variables, call stacks, and breakpoints. To learn more how to debug your project see here. |
|
DB Interface Explorer | Enables exploring the project's DB interfaces, showing schemas, tables, views, and columns. According to the opened editor's context it lets you apply actions like: executing SQL queries at Query Builder, adding DB statements to Fabric functions, adding DB actors to Broadway and adding an SQL section to Graphit. To learn more about using the Git tool within the Web Studio see here. |
|
Log Viewer | Enables you to select and view Fabric logs, in a rich and useful mode. When clicked it allows you to select which log to open (from the Side Bar). To learn more about Log Viewer and how to use it effectively see here. |
Tip: You can change the order of views in the Activity Bar by dragging and dropping them.
Command Palette
The Command Palette is an interactive window that provides access to the Fabric Web Studio functionality, including keyboard shortcuts for many common operations. You can open files, execute editor commands, and launch Fabric dedicated editors such as Create New LU, Create new Broadway flow and many more.
You can reach the Command Palette from the top menu by selecting View > Find command or use ⇧⌘P in Mac or F1 in Windows to bring it up.
To learn more about useful Command Palette commands and shortcuts see here.
Color Themes
As part of Web Studio Settings Capabilities, you can modify the colors in the Visual Studio Code's user interface to suit your preferences and work environment.
To select a color theme
- Open the Color Theme picker with File > Preferences > Color Theme. You can open it also by using the Preference gear icon located at the bottom left area of Web Studio.
- Use the cursor keys to preview the colors of the theme.
- Select a desired theme and click Enter.
Notes:
- Fabric Web Studio is basically a Visual Studio code-like editor, with small differences. While you can look and learn from VS Code's many user guides, keep in mind that they are not the same.
- Fabric Web Studio follows the current Fabric Desktop Studio concept in terms of having a code editor orientation and being a file and folder based.
- Fabric Web Studio is fully compatible and compliant with the Desktop Studio. You can smoothly switch between them while implementing your project.
The Project Tree
The Project Tree displays the components of the current project as a hierarchy of entities. The project is the top-level in the hierarchy. Each project has the following branches (sub-objects):
- Shared Objects, the objects used by all Logical Units and project references.
- References, reference information that may be used throughout the instance. References includes also common project's tables.
- Web Services, a collection of all functions that are defined as Web Services for this project.
- Logical Units, a collection of all Logical Units defined in the project.
Click for more information about the Project Tree.
Click for more information about the Query Builder.
Click for more information Fabric Studio log file.
