


Query Builder Window
The Query Builder window has 2 parts:
- Query Builder - where you can build and run an SQL query on selected DB Tables, Views or Synonyms.
- Results - displays the results of the executed SQL query.
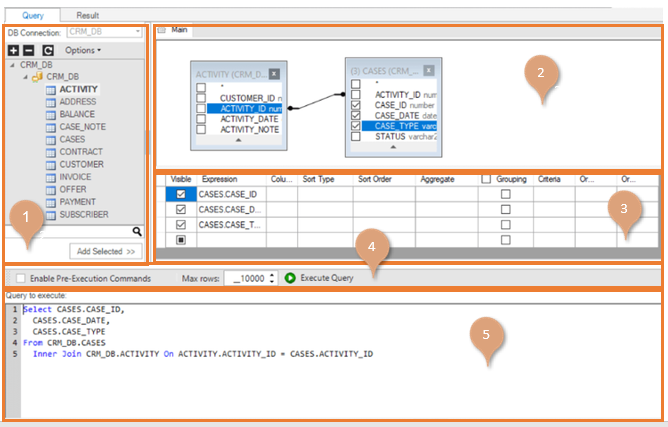
Query Tab
The Query tab enables you to build and run an SQL query on selected DB Tables and is divided into the following working areas:
- DB Tree (top left) - enables selecting a Project’s DB Interface from the DB Interfaces drop-down list, and it displays a tree of DB objects (Tables, Views, and Synonyms) and their columns of the selected DB interface.
- Main Window (top right) - displays a graphical map of the selected tables and columns for the SQL query.
- Selected Columns Table (bottom right) - displays the same information as the Main Window in a tabular format and enables editing the SQL query.
- Query Settings toolbar.
- Query display (bottom of the window) - displays the generated SQL statement, which can be edited manually.
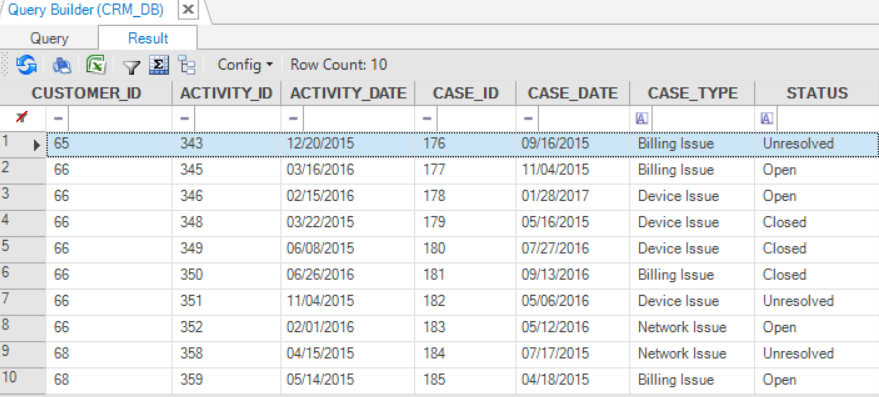
Result Tab
Displays the data received from the executed query. Click on Export to Excel to export the data into an Excel file.
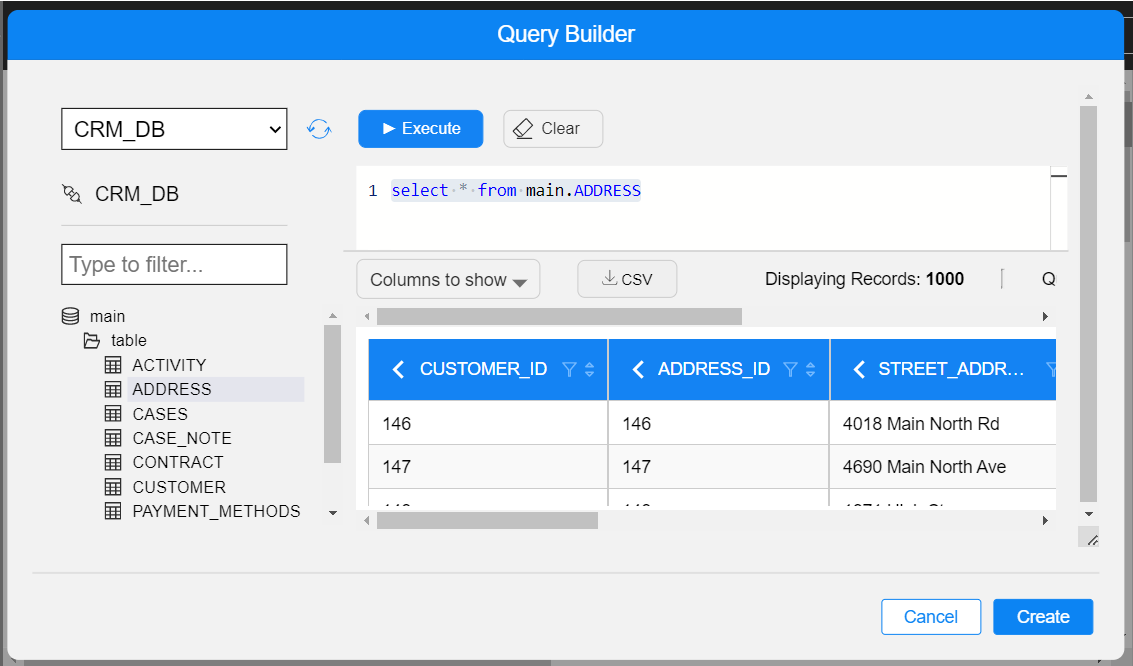
When opened via the DB Interface Explorer, or from Instance Group or Views editors, the Query Builder opens in the main panel, on the right.
When opened from either the Schema Editor table's view, Graphit or Broadway - the Query Builder opens as a popup window:
You can control the sizes of the Query Editor and the Results windows: Hover your mouse cursor over the horizontal separating line, which appears between these parts, and you will see the ellipsis indication; your cursor type will turn to be a cursor-resize
. Use it to resize the windows' heights.
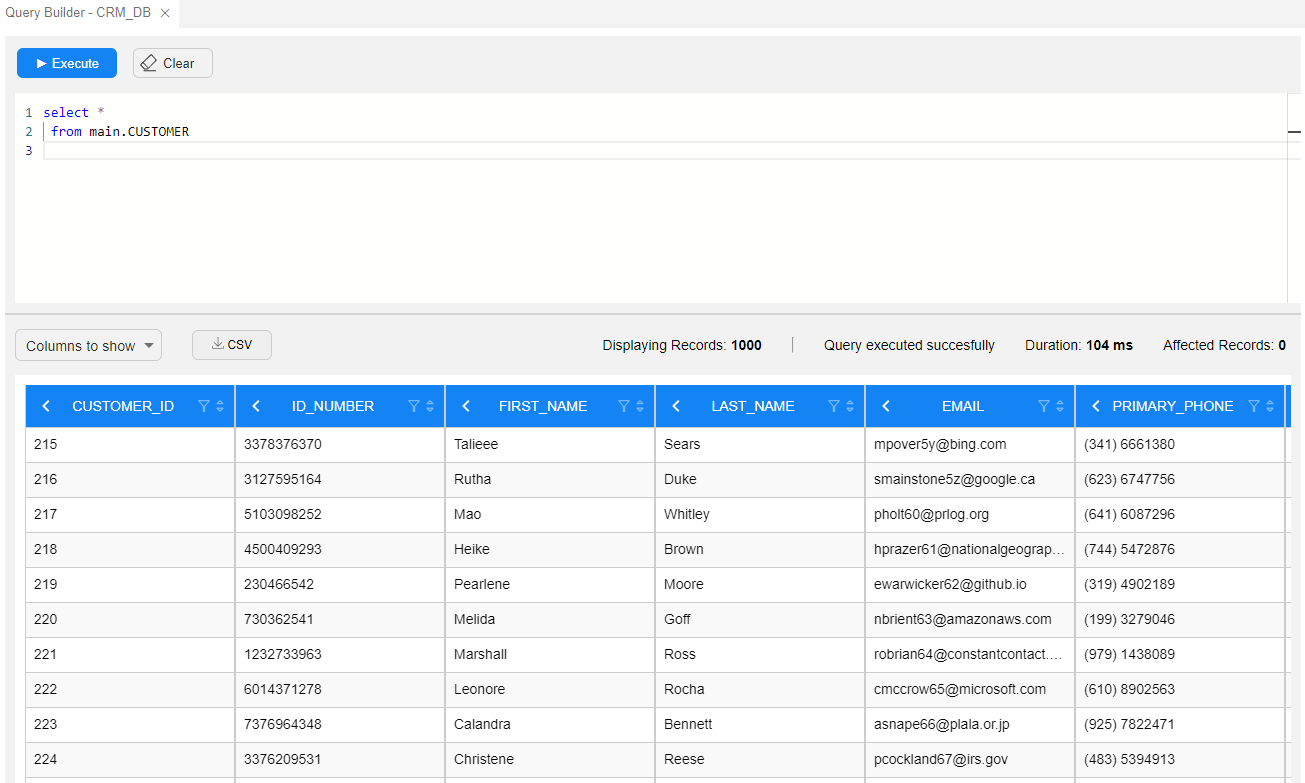
Query Editor Panel
You can edit the SQL commands in the Query Editor panel - the upper part of the Query Builder window. Read here more details about editing a SQL commands at the Query Editor.
It contains the editing area and top action bar, where you can run your query by clicking on the Execute button or clear the editing area by clicking on the Clear button.
Note: You can open Query Builder where Fabric is the data source. In such case, several fields will be shown in the top bar of the Query Editor panel: Sync mode, Select LU, Instance ID. Set these fields before executing the query.

Results Panel
When executing the query, the results are presented in a table view in the Results window (bottom part).
The Results window shows up to 1000 entries.
The Results window's top bar is divided into 2 parts: information (on the right side) and actions (on the left side):
- Information part contains:
- Number of displayed rows (as previously explained, up to 1000 rows).
- Query status - success/failure. In case of a failure, a failure reason will be shown in the results area, instead of the results table.
- Duration taken to execute the query. Note that the duration is not the time until the results table is rendered and displayed as a table in the results window.
- How many rows were affected during the query execution. In case of a select statement, no rows are affected, so it would show zero.
- Actions part contains:
- Columns to show - allows to adjust the Results table display. When clicked, a pop-up opens where you can set up the Result tables columns that will be shown.
- CSV - allows to download the results.
The Results table enables some manipulations that let you adjust the display according to your needs, in addition to the Columns to show option:
Sort Order - click on the column's header sort icon
 to reorder the table (Ascending/Descending).
Filter - click on the column's header filter icon
 to filter table's display accordingly.
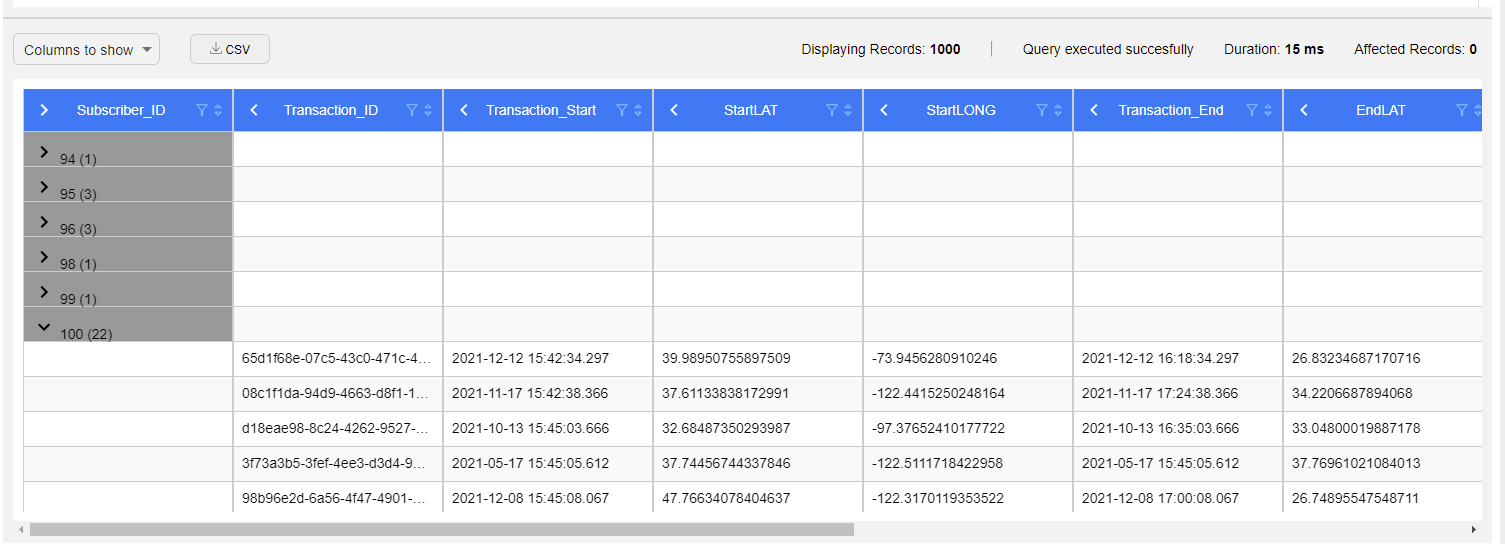
Group - click on the column's header left arrow to group the table rows by this column.
Grouping by a column will show it as the left most column, change its color to gray and flip the arrow direction.
Click on a table row arrow to expand and collapse its grouped rows.
You can group by several columns.
To ungroup, click again on the column header arrow.


Query Builder Window
The Query Builder window has 2 parts:
- Query Builder - where you can build and run an SQL query on selected DB Tables, Views or Synonyms.
- Results - displays the results of the executed SQL query.
Query Tab
The Query tab enables you to build and run an SQL query on selected DB Tables and is divided into the following working areas:
- DB Tree (top left) - enables selecting a Project’s DB Interface from the DB Interfaces drop-down list, and it displays a tree of DB objects (Tables, Views, and Synonyms) and their columns of the selected DB interface.
- Main Window (top right) - displays a graphical map of the selected tables and columns for the SQL query.
- Selected Columns Table (bottom right) - displays the same information as the Main Window in a tabular format and enables editing the SQL query.
- Query Settings toolbar.
- Query display (bottom of the window) - displays the generated SQL statement, which can be edited manually.
Result Tab
Displays the data received from the executed query. Click on Export to Excel to export the data into an Excel file.
When opened via the DB Interface Explorer, or from Instance Group or Views editors, the Query Builder opens in the main panel, on the right.
When opened from either the Schema Editor table's view, Graphit or Broadway - the Query Builder opens as a popup window:
You can control the sizes of the Query Editor and the Results windows: Hover your mouse cursor over the horizontal separating line, which appears between these parts, and you will see the ellipsis indication; your cursor type will turn to be a cursor-resize
Query Editor Panel
You can edit the SQL commands in the Query Editor panel - the upper part of the Query Builder window. Read here more details about editing a SQL commands at the Query Editor.
It contains the editing area and top action bar, where you can run your query by clicking on the Execute button or clear the editing area by clicking on the Clear button.
Note: You can open Query Builder where Fabric is the data source. In such case, several fields will be shown in the top bar of the Query Editor panel: Sync mode, Select LU, Instance ID. Set these fields before executing the query.
Results Panel
When executing the query, the results are presented in a table view in the Results window (bottom part).
The Results window shows up to 1000 entries.
The Results window's top bar is divided into 2 parts: information (on the right side) and actions (on the left side):
- Information part contains:
- Number of displayed rows (as previously explained, up to 1000 rows).
- Query status - success/failure. In case of a failure, a failure reason will be shown in the results area, instead of the results table.
- Duration taken to execute the query. Note that the duration is not the time until the results table is rendered and displayed as a table in the results window.
- How many rows were affected during the query execution. In case of a select statement, no rows are affected, so it would show zero.
- Actions part contains:
- Columns to show - allows to adjust the Results table display. When clicked, a pop-up opens where you can set up the Result tables columns that will be shown.
- CSV - allows to download the results.
The Results table enables some manipulations that let you adjust the display according to your needs, in addition to the Columns to show option:
Sort Order - click on the column's header sort icon
to reorder the table (Ascending/Descending).Filter - click on the column's header filter icon
to filter table's display accordingly.Group - click on the column's header left arrow to group the table rows by this column.
Grouping by a column will show it as the left most column, change its color to gray and flip the arrow direction.
Click on a table row arrow to expand and collapse its grouped rows.
You can group by several columns.
To ungroup, click again on the column header arrow.
